Typical performance characteristics – Diodes ULN200xA User Manual
Page 8
ULN2002A/ ULN2003A/ ULN2004A
Document number: DS35313 Rev. 5 - 2
8 of 11
June 2014
© Diodes Incorporated
ADVAN
CE I
N
F
O
RM
ATI
O
N
ULN2002A/ ULN2003A/ ULN2004A
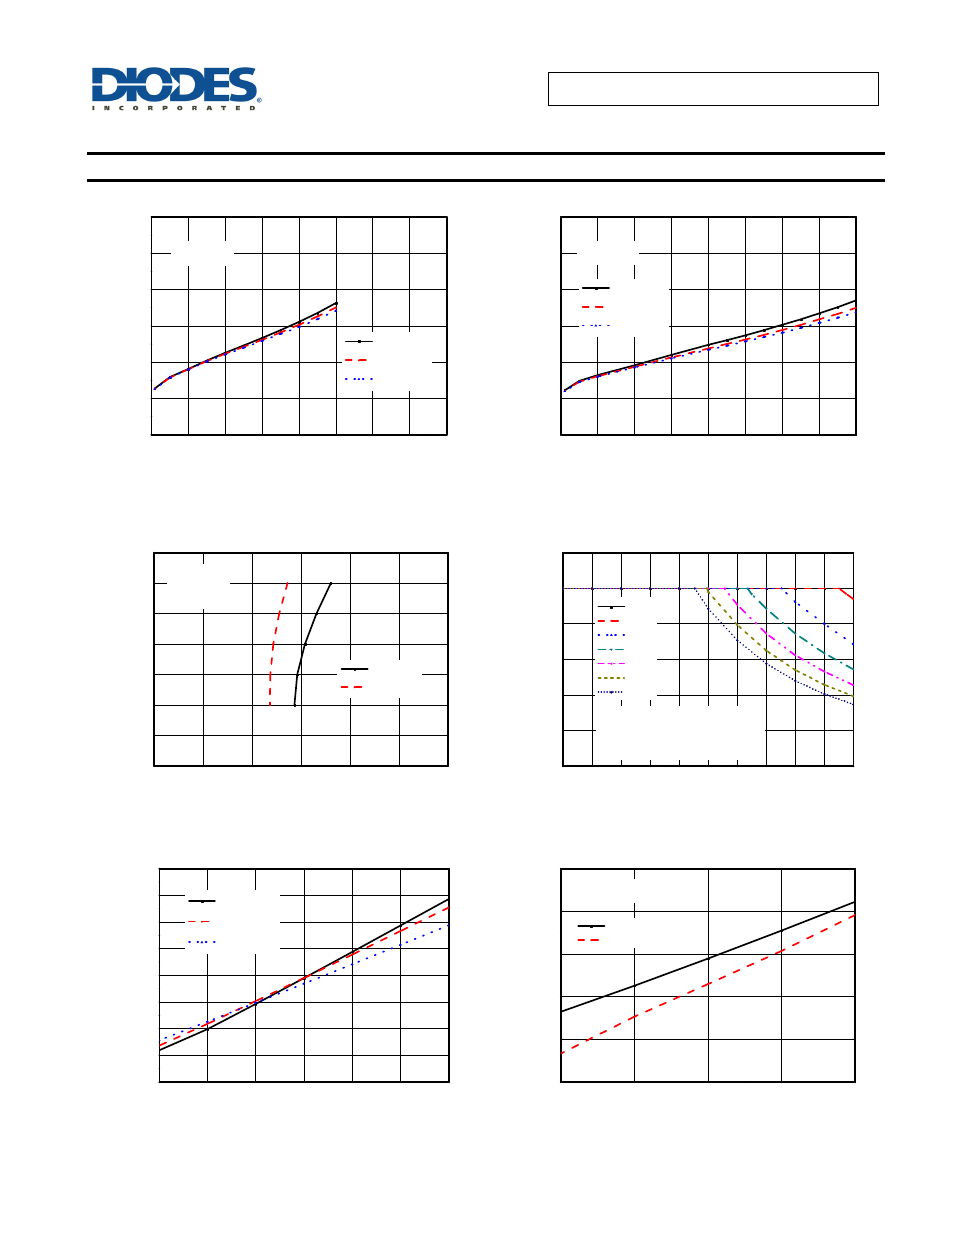
Typical Performance Characteristics
0
100
200
300
400
500
600
700
800
0.4
0.6
0.8
1.0
1.2
1.4
1.6
T
A
= 25
O
C
C
o
lle
ct
o
r-E
m
it
te
r S
atu
ra
tio
n
V
o
lta
g
e
(V
)
Collector Current (mA)
I
I
= 250
μ
A
I
I
= 350
μ
A
I
I
= 500
μ
A
Figure 11 Collector-Emitter Saturation Voltage vs.
Collector Current (One Darlington
0
100
200
300
400
500
600
700
800
0.4
0.6
0.8
1.0
1.2
1.4
1.6
C
o
lle
ct
o
r-E
m
it
te
r S
atu
ra
tio
n
V
o
lta
g
e
(V
)
Total Collector Current (mA)
I
I
= 250
μ
A
I
I
= 350
μ
A
I
I
= 500
μ
A
T
A
= 25
O
C
Figure 12 Collector-Emitter Saturation Voltage vs.
Collector Current (Two Darlington in Parallel)
0
25
50
75
100
125
150
150
200
250
300
350
400
450
500
Co
llector
Cur
re
n
t (mA)
Input Currnet (
μ
A)
V
S
= 8 V
V
S
= 10 V
R
L
= 10
Ω
T
A
= 25
O
C
Figure 13 Collector Current vs. Input Current
0
10
20
30
40
50
60
70
80
90
100
0
100
200
300
400
500
600
M
axi
m
u
m
Col
lect
or Current
(m
A)
Duty Cycle (%)
N = 1
N = 2
N = 3
N = 4
N = 5
N = 6
N = 7
T
A
= 70
O
C
N = Number of Outputs
Conducting Simultaneously
Figure 14 Maximum Collector Current vs. Duty Cycle
2.0
2.5
3.0
3.5
4.0
4.5
5.0
0
200
400
600
800
1000
1200
1400
1600
Inpu
t C
u
rr
ent
(
μ
A)
Input Voltage (V)
T
A
= -40
O
C
T
A
= 25
O
C
T
A
= 105
O
C
Figure 15 Input Current vs. Input Voltage
100
200
300
400
500
0.7
0.8
0.9
1.0
1.1
1.2
Col
le
ctor-E
mi
tt
er Sat
u
rati
o
n
V
o
lt
age (
V
)
Output Current (mA)
Maximum
Typical
T
J
= - 40
O
C to 105
O
C
Figure 16 Collector-Emitter Saturation Voltagevs.
Output Current