Calibration & accuracy – Analytical Industries GPR-1200 MS ATEX Portable PPB Oxygen Analyzer User Manual
Page 11
11
Calibration & Accuracy
Single Point Calibration: As previously described the galvanic oxygen sensor generates an electrical current
sensor exhibiting an absolute zero, e.g. the sensor does not generate a current output in the absence of oxygen.
Given these linearity and absolute zero properties, single point calibration is possible.
Pressure: Because sensors are sensitive to the partial pressure of oxygen in the sample gas their output is a
function of the number of molecules of oxygen 'per unit volume'. Readouts in percent are permissible only when
the total pressure of the sample gas being analyzed remains constant. The pressure of the sample gas and that of
the calibration gas(es) must be the same (reality < 1-2 psi).
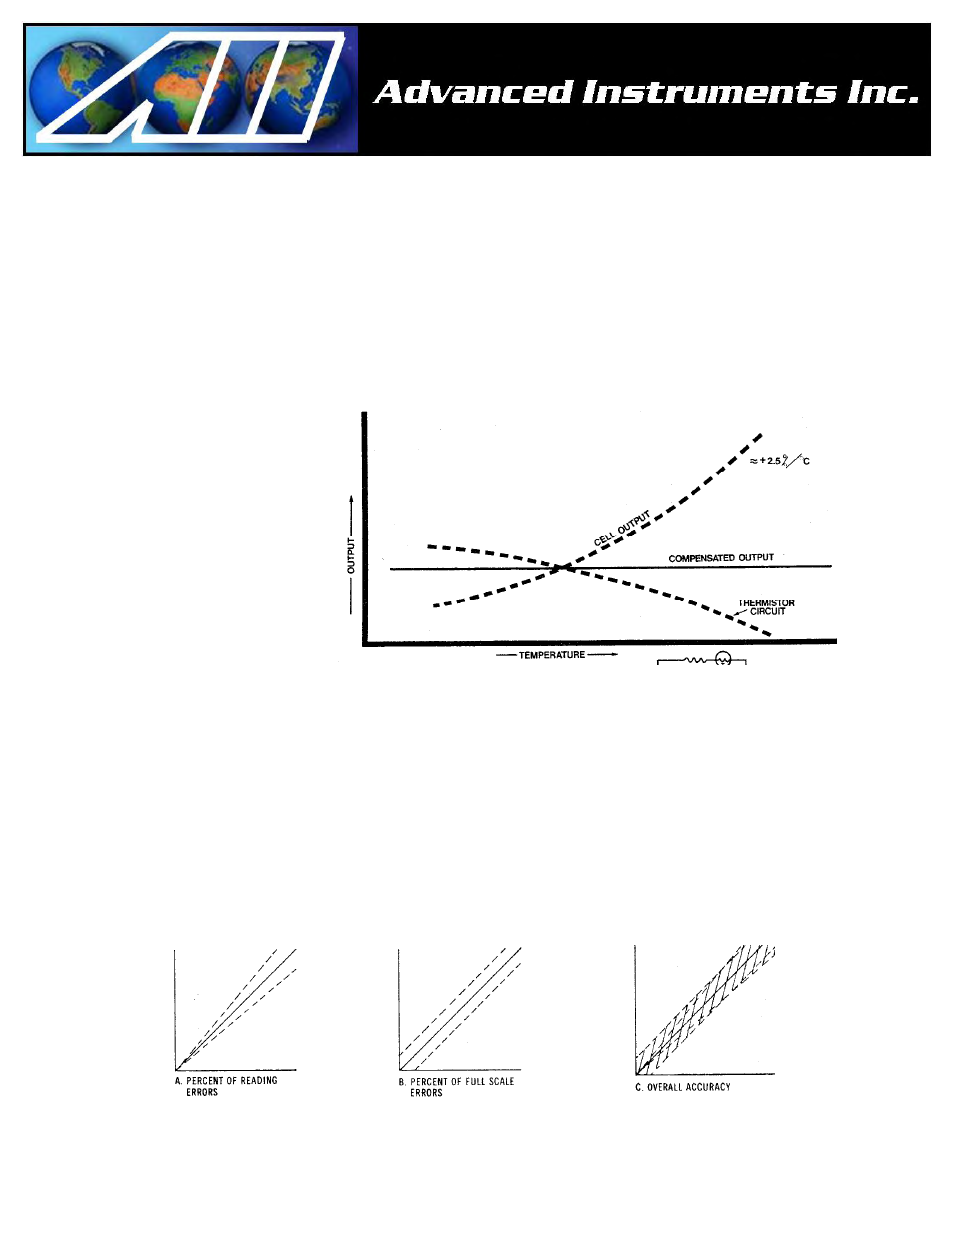
Temperature: The rate oxygen
molecules diffuse into the sensor is
controlled by a Teflon membrane
otherwise known as an 'oxygen
diffusion limiting barrier' and all
diffusion processes are
temperature sensitive, the fact the
sensor's electrical output will vary
with temperature is normal. This
variation is relatively constant
2.5% per ºC. A temperature
compensation circuit employing a
thermistor offsets this effect with
an
accuracy of +5% or better and
generates an output function that is independent of temperature. There is no error if the calibration and sampling
are performed at the same temperature or if the measurement is made immediately after calibration. Lastly, small
temperature variations of 10-15º produce < +1% error.
Accuracy: In light of the above parameters, the overall accuracy of an analyzer is affected by two types of errors:
1) those producing 'percent of reading errors', illustrated by Graph A below, such as +5% temperature
compensation circuit, tolerances of range resistors and the 'play' in the potentiometer used to make span
adjustments and 2) those producing 'percent of full scale errors', illustrated by Graph B, such as +1-2% linearity
errors in readout devices, which are really minimal due to today's technology and the fact that other errors are
'spanned out' during calibration.
Graph C illustrates these 'worse case' specifications that are typically used to develop an analyzer's overall accuracy
statement of +2% of full scale at constant temperature or +5% over the operating temperature range. QC testing
is typically <+0.5% prior to shipment.