Ocean Optics LPC-500CM User Manual
Page 17
2: Setup
041-00000-010-02-201106
9
2. While in Scope Mode, save a dark spectrum with the light source off and a reference spectrum
with the light source on.
3. Continue to pump the sample fluid and switch to the Absorbance Mode. Ideally, you should see a
spectrally flat line (see Example Spectra below). Particle effects manifest themselves as an
exponentially decreasing curve from shorter to longer wavelengths. The length of time that you
pump the sample and the magnitude of the absorbance peak depend upon the time required and
the minimum detectable absorbance value for your specific analyses. Prefiltering of the sample
may be required to eliminate this exponentially decreasing absorbance spectrum if it is significant
to your analyses.
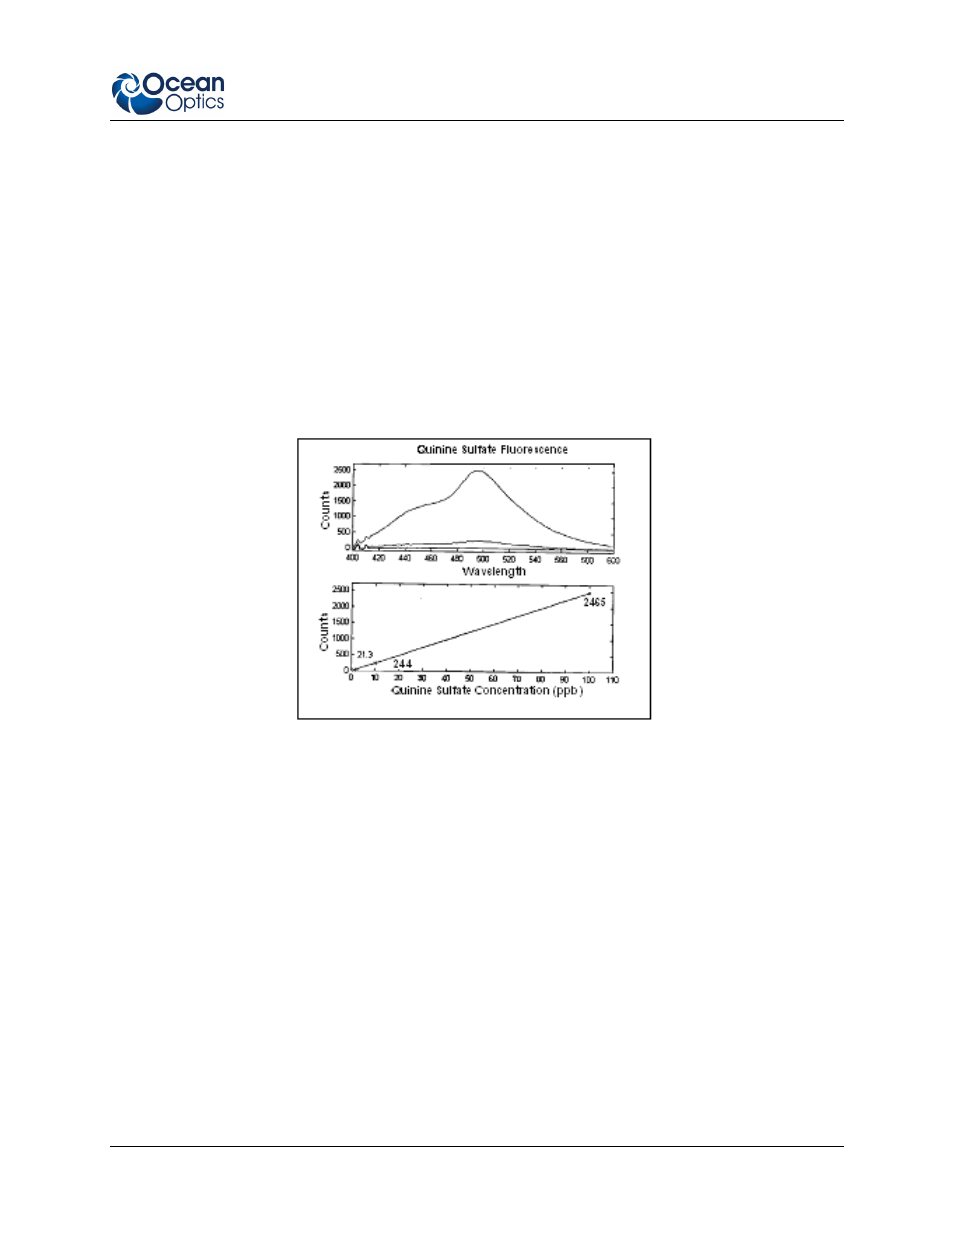
The following sample fluorescence spectra of quinine sulfate solution were obtained with an S2000 Fiber
Optic Spectrometer (100
m slit, L2 Detector Collection Lens) and 1-meter LWCC with built-in 365-nm
excitation source. The integration period was 500 milliseconds. Intensity was linear with concentration.
The lowest detectable concentration of the sample was ~0.5 ppb.
Example Spectra