5 display area – Soft dB Opus Suite Building Acoustics Module Reverberation Time ISO 3382 User Manual
Page 13
12
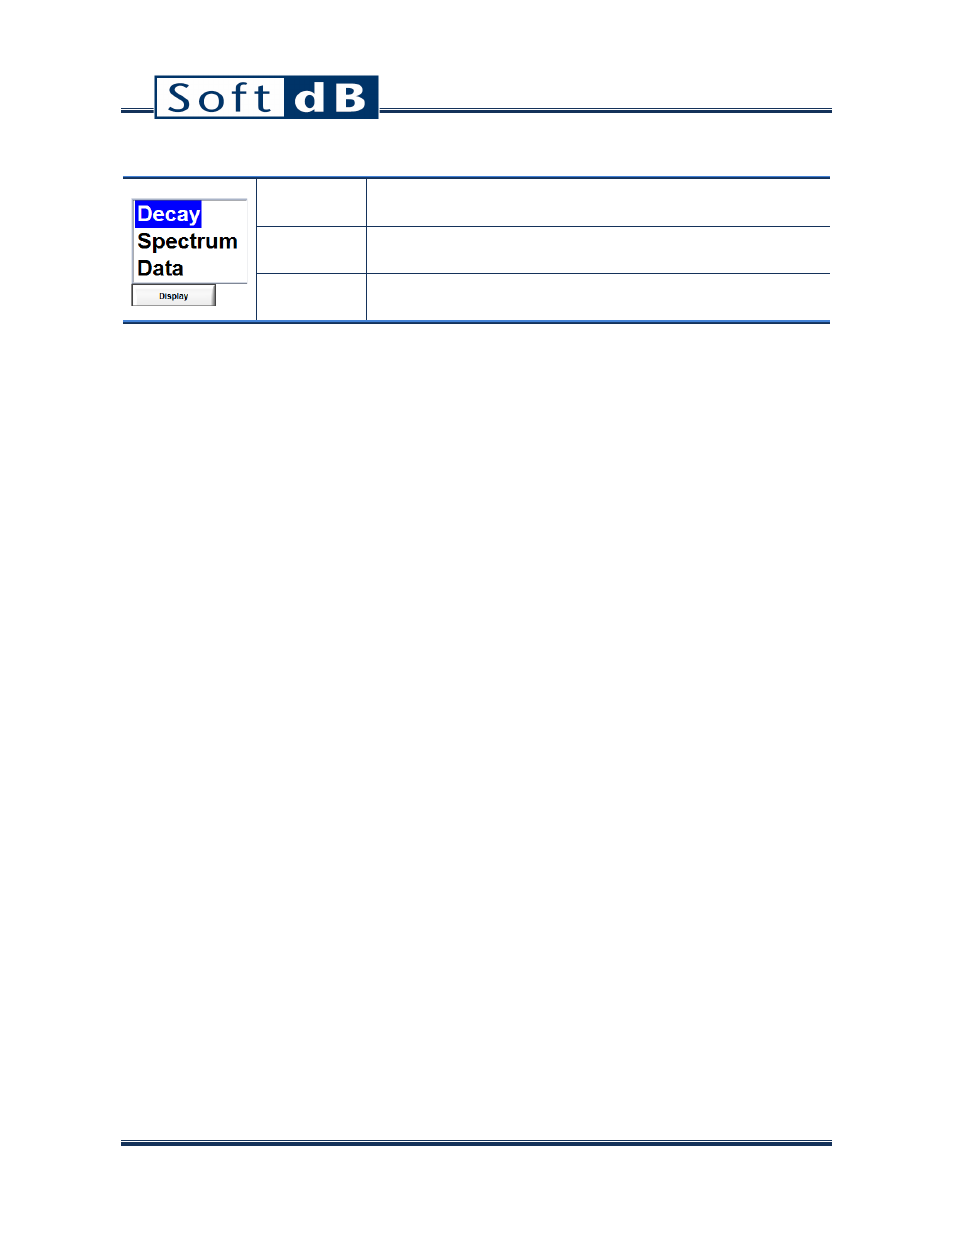
Display Menu
Decay:
This item sets the interface to display the time decay for a
specified frequency band or global.
Spectrum:
This item sets the interface to display a specified reverberation
index for all frequency bands and global on a bar graph.
Data:
This item sets the interface to display all the reverberation
indexes for all frequency bands and global in an array.
5.5 Display Area
Data can be presented using one of three available displays:
• Decay (see section 6.5.1, p. 13)
• Spectrum (see section 6.5.2, p. 14)
• Data (see section 6.5.3, p. 15)