SUUNTO Cobra User Manual
Page 25
23
3.3.4. CONSUMED BOTTOM TIME (CBT)
The available no-decompression stop time is also shown visually in the multi-
function bar graph on the left side of the display (Fig. 3.7., 3.8. and 3.9.). When
your available no-decompression time decreases below 200 minutes, the fi rst
(lowest) bar graph segment appears. As your body absorbs more nitrogen, more
segments start to appear.
Green Zone - As a safety precaution Suunto recommends you should maintain
the no-decompression bar graph within the green zone. Segments start to appear
when the available no-decompression time decreases below 100, 80, 60, 50, 40,
30 and 20 minutes.
Yellow Zone - As the bars reach the yellow zone, your no-decompression stop time
is less than 10 or 5 minutes and you are getting very close to no-decompression
limits. At this point, you should start your ascent towards the surface.
Red Zone - As all of the bars appear (red zone), your no-decompression stop time
has become zero and your dive has become a decompression stop dive (for more
information see section 3.3.6. “Decompression dives”).
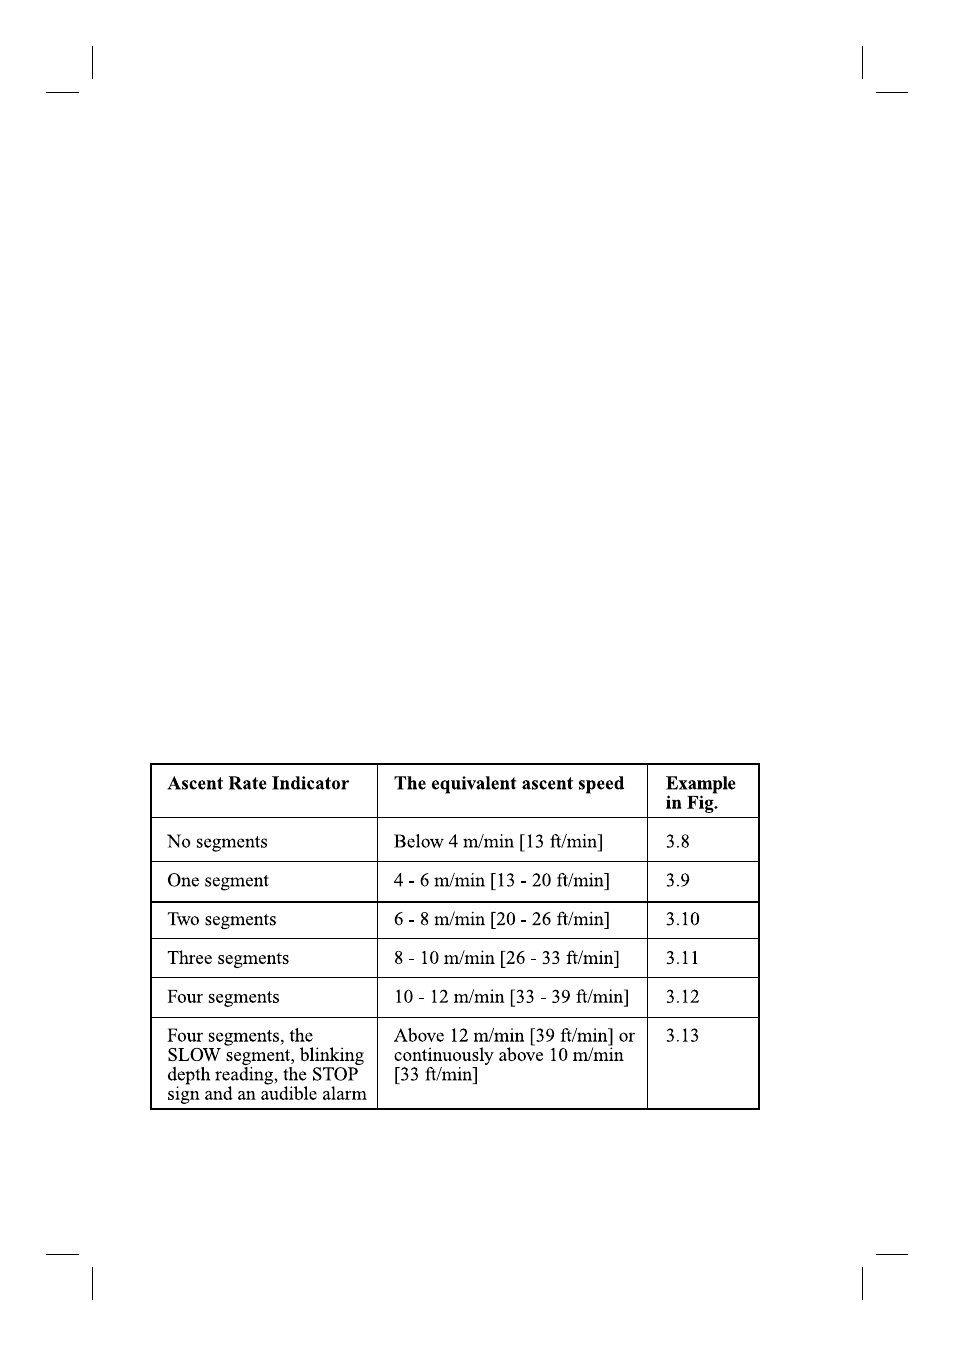
3.3.5. ASCENT RATE INDICATOR
The ascent rate is shown graphically along the right side of the display as
follows:
TABLE 3.2. ASCENT RATE INDICATOR