Figure 3–24. distortion versus frequency, Figure 3–25. crosstalk versus frequency – Texas Instruments TPA005D02 User Manual
Page 46
TPA005D02 Class D EVM Measured Characteristics
3-32
Details
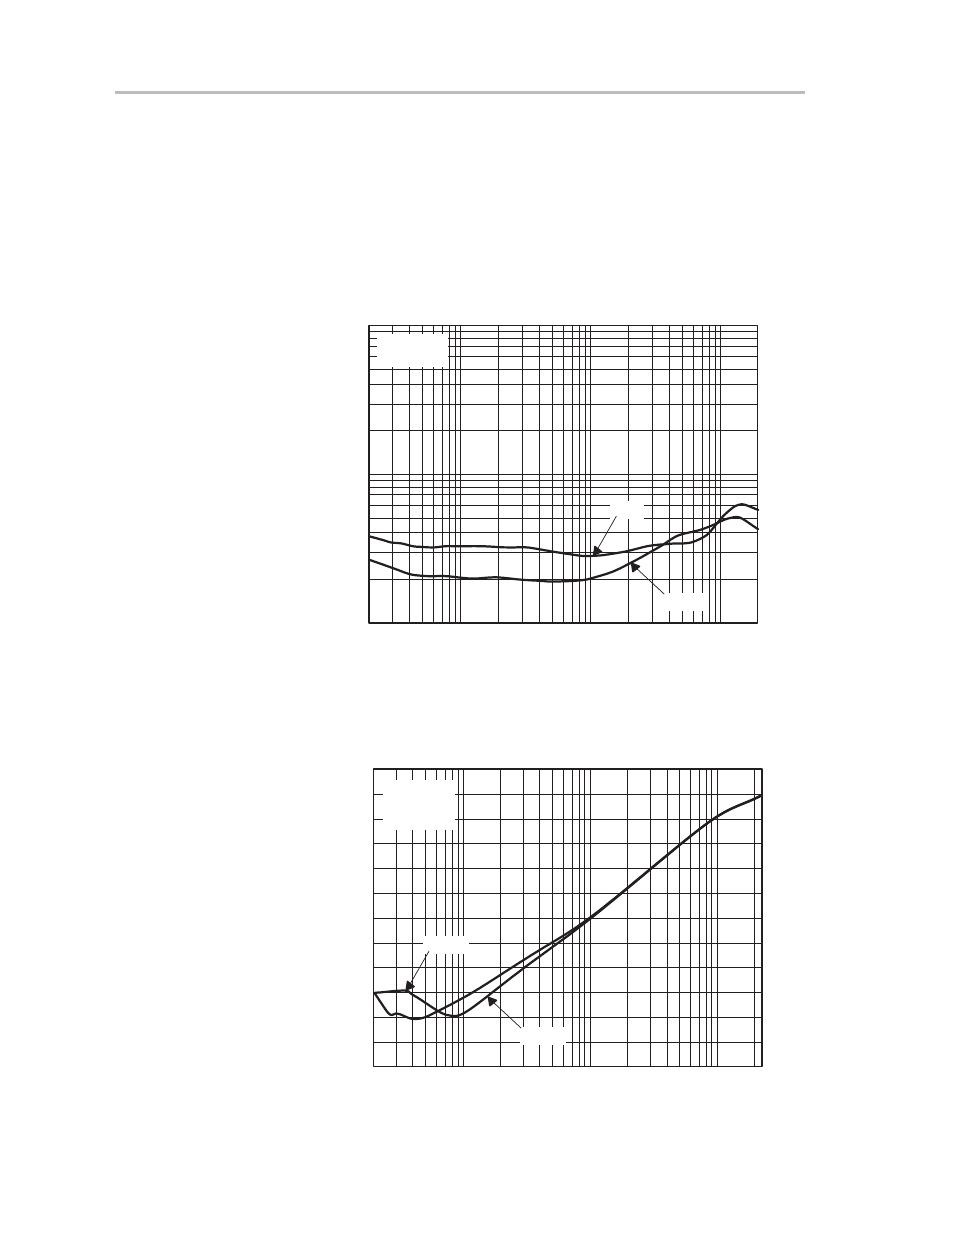
THD+N versus frequency is shown in Figure 3–24, and correlates with the data
shown in Figure 3–23. The rise in distortion at higher frequencies is due
primarily to the increase in crosstalk with frequency (Figure 3–25). The
crosstalk was measured at full output power, which is the worst-case scenario.
Crosstalk may be reduced by using shielded inductors in the output filter.
Figure 3–24. Distortion versus Frequency
10
0.1
20
100
1k
THD+N – T
otal Harmonic Distortion Plus Noise – (%)
TOTAL HARMONIC DISTORTION PLUS NOISE
vs
FREQUENCY
10k
20k
5
2
0.5
0.2
1
VDD = 5 V
RL = 4
Ω
1 W
1/2 W
Figure 3–25. Crosstalk versus Frequency
20
100
1k
Crosstalk – dB
f – Frequency – Hz
CROSSTALK
vs
FREQUENCY
10k
20k
VDD = 5 V
RL = 4
Ω
PO =
2
W
– 30
– 35
– 40
– 45
– 50
– 55
– 60
– 65
– 70
– 75
– 80
– 85
– 90
L to R
R to L
- THS4151 (26 pages)
- TRF1500 (74 pages)
- SLOU082 (28 pages)
- TAS5508-5121K8EVM (24 pages)
- TPA6102A2 (16 pages)
- TPA3001D1EVM (22 pages)
- TPA6030A4 (25 pages)
- TPA701 (26 pages)
- TPA6110A2 MSOP (18 pages)
- TAS5727 (21 pages)
- THS4503EVM (28 pages)
- SLOU121 (42 pages)
- TPA0243 (20 pages)
- TPA0253 (20 pages)
- TPA102 MSOP (26 pages)
- THS4131 (26 pages)
- SLOU020A (28 pages)
- TPA751 MSOP (20 pages)
- TPA005D12 (44 pages)
- TPA6139A2 EVM (8 pages)
- TPA0103 (32 pages)
- SLOU106 (26 pages)
- THS4141 (26 pages)
- THS3001 (20 pages)
- TPA0233 (20 pages)
- TPA2008D2 (26 pages)
- 2004 (20 pages)
- TPA3003D2 (36 pages)
- SLAU081 (44 pages)
- TPA301 (28 pages)
- TPA3100D2 (11 pages)
- SLOU023A (26 pages)
- TAS5110D6REF (45 pages)
- TA5704EVM (27 pages)
- TAS5518 (20 pages)
- APA100 (42 pages)
- TPA3200D1 (30 pages)
- TAS5066PAG (22 pages)
- TPA6204A1 (16 pages)
- THS4150 (26 pages)
- TPA311 (28 pages)
- TPA3008D2 (31 pages)
- TPA6101A2 (16 pages)