2 viewing a composite display – Frye FONIX 7000 User Manual
Page 64
56
FONIX 7000 Hearing Aid Analyzer
Refer to Figure 3.1.1 for the following explanation of the graphical display:
1. Type of display. This will be either dB SPL (coupler output) or dB Gain (cou-
pler gain).
2. Selected ear.
3. Curve Characteristics box. See Section 2.5.1 for more details.
4. Signal type and leveling status.
5. Selected noise reduction.
6. Maximum output and three-frequency average of the selected curve.
7. Source Signal Statistics Box. Displays the source amplitude, frequency, dis-
tortion, and output/gain.
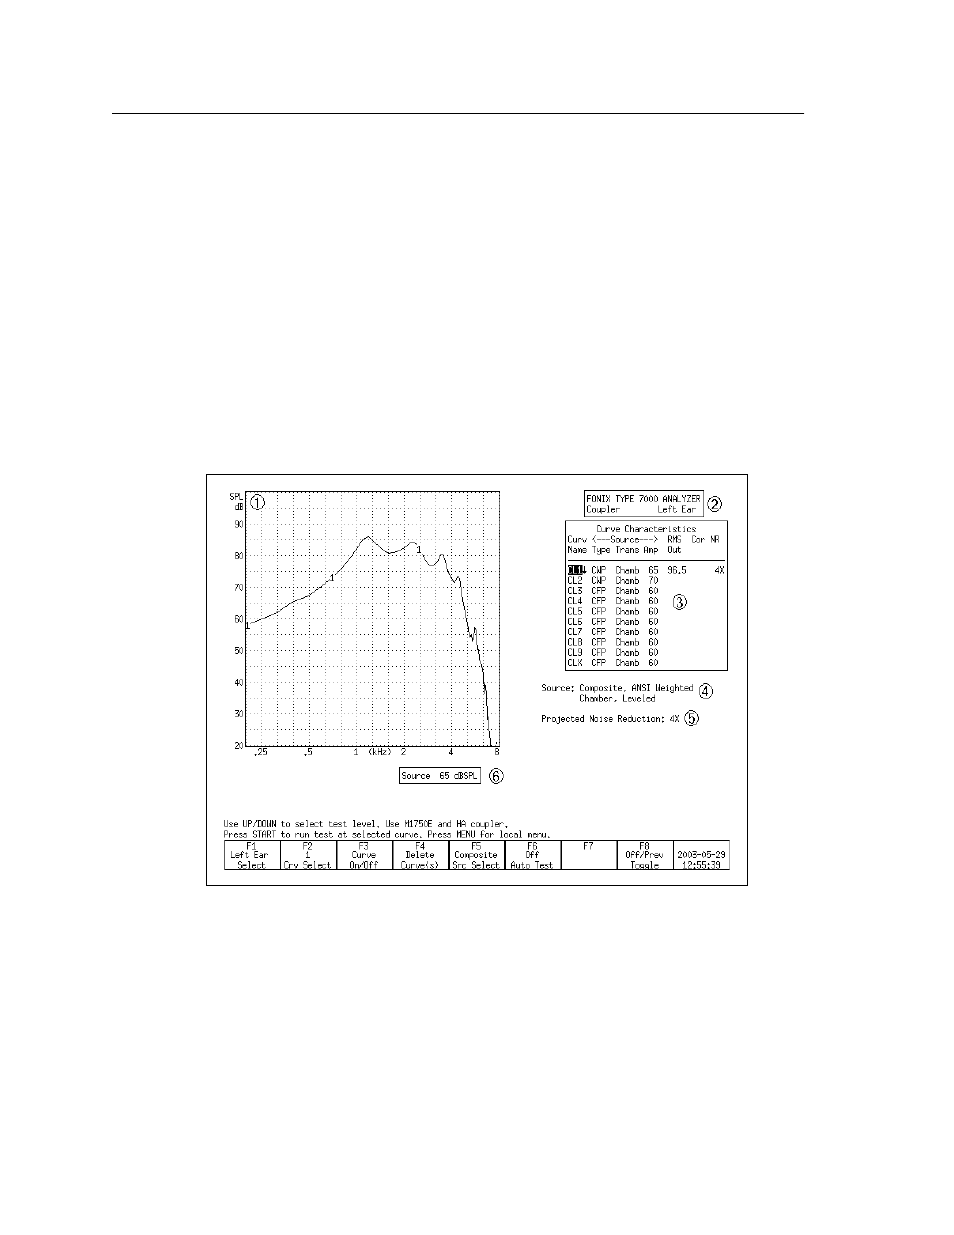
3.1.2 Viewing a Composite Display
Figure 3.1.2—Coupler screen with a Composite source
Refer to Figure 3.1.2 for the following explanation of the graphical display:
1. Type of display. This will be either dB SPL (coupler output) or dB Gain (cou-
pler gain).
2. Selected ear.
3. Curve Characteristics box. See Section 2.5.1 for more details.