Bird Technologies 429-83H-01 Series-Manual User Manual
Page 29
TX RX Systems Inc. Manual 7-9439-6 09/03/09 Page 21
8) Use the ARROW buttons to scroll over to the
STATIC W/LOAD menu choice and press the
ENTER button.
9) Use the ARROW buttons to dial in the static
sensitivity value (from the signal generator) and
press the ENTER button to save the information
in memory. By storing the sensitivity value at
the time of installation it can be compared with
future tests and used as an indication of system
degradation or failure. In general, the sensitivity
measured with the antenna will be less than
that measured with the load unless site noise is
at a minimum.
The sensitivity value measured in
step 5 is less (45 dB plus Test Line
loss) than the actual sensitivity
value.
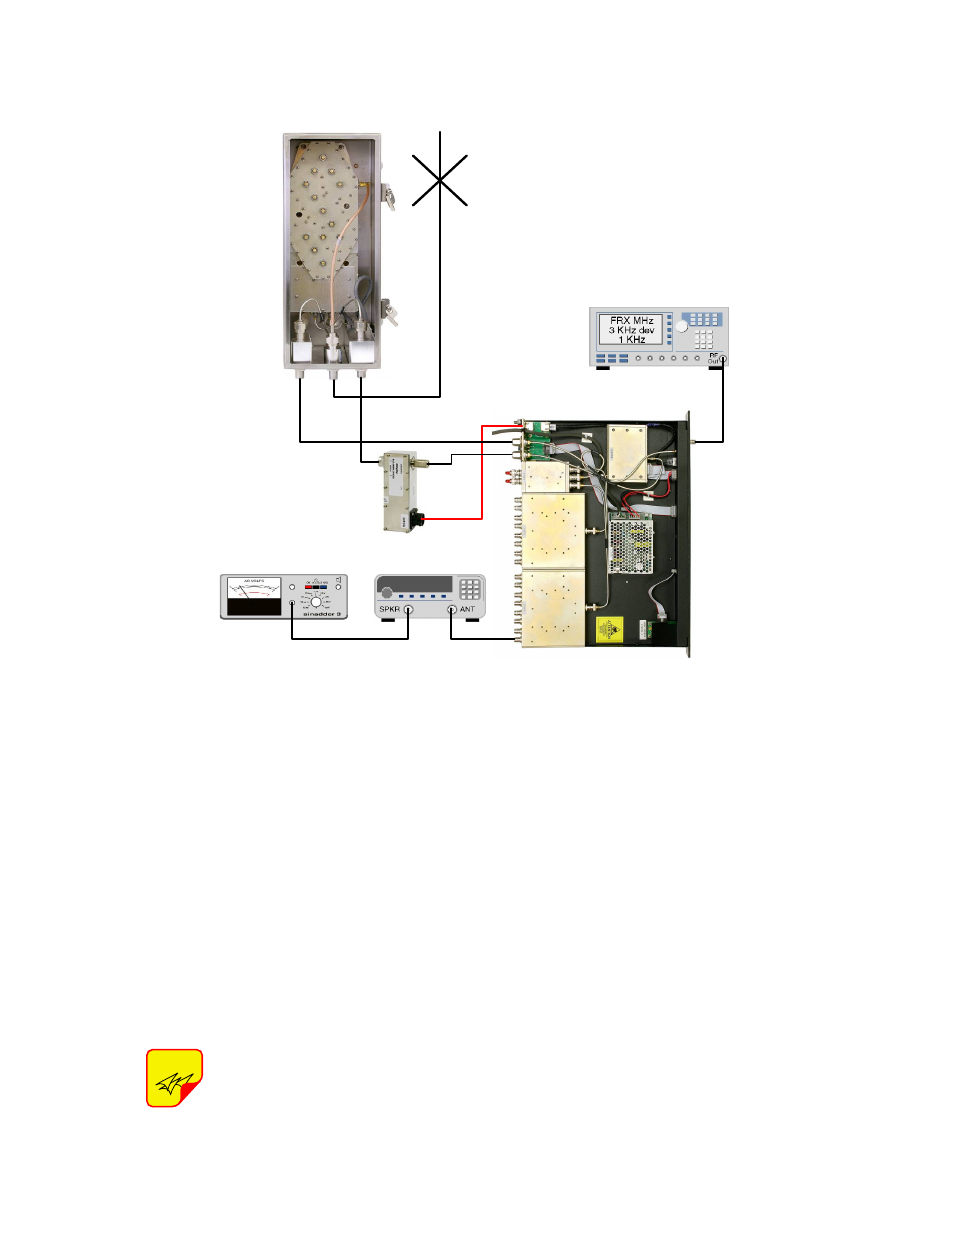
Effective System Sensitivity
The Effective System Sensitivity is the sensitivity
as seen by the subscriber. This represents the
Talk-in coverage component of the infrastructure.
To determine the Effective System Sensitivity the
signal level into the first amplifier must be known.
The easiest way to achieve this is to inject a test
signal into the Test Port (located on the front panel
of the base unit) and measure the BER or SINAD
of the test receiver. The effective system sensitivity
can only be measured while the active tower-top
LNA is connected to the antenna. Once you have
made the measurement the actual effective system
sensitivity can be calculated. Figure 17 shows the
formula for calculating the actual effective system
sensitivity as well as a worked through example.
NOTE
Signal Generator
MCU
Front
Panel
Test
Port
Tower Top Box
Lightning Arrester
TX RX part no. 8-21550
12 dB SINAD
Receiver
CAT-5e
Cable
Diagnostic
Cable
Test
Ant
Antenna
Main
Figure 18: Using the test port to measure sensitivity of the TTA system.