MTS Landmark TWX User Manual
Page 121
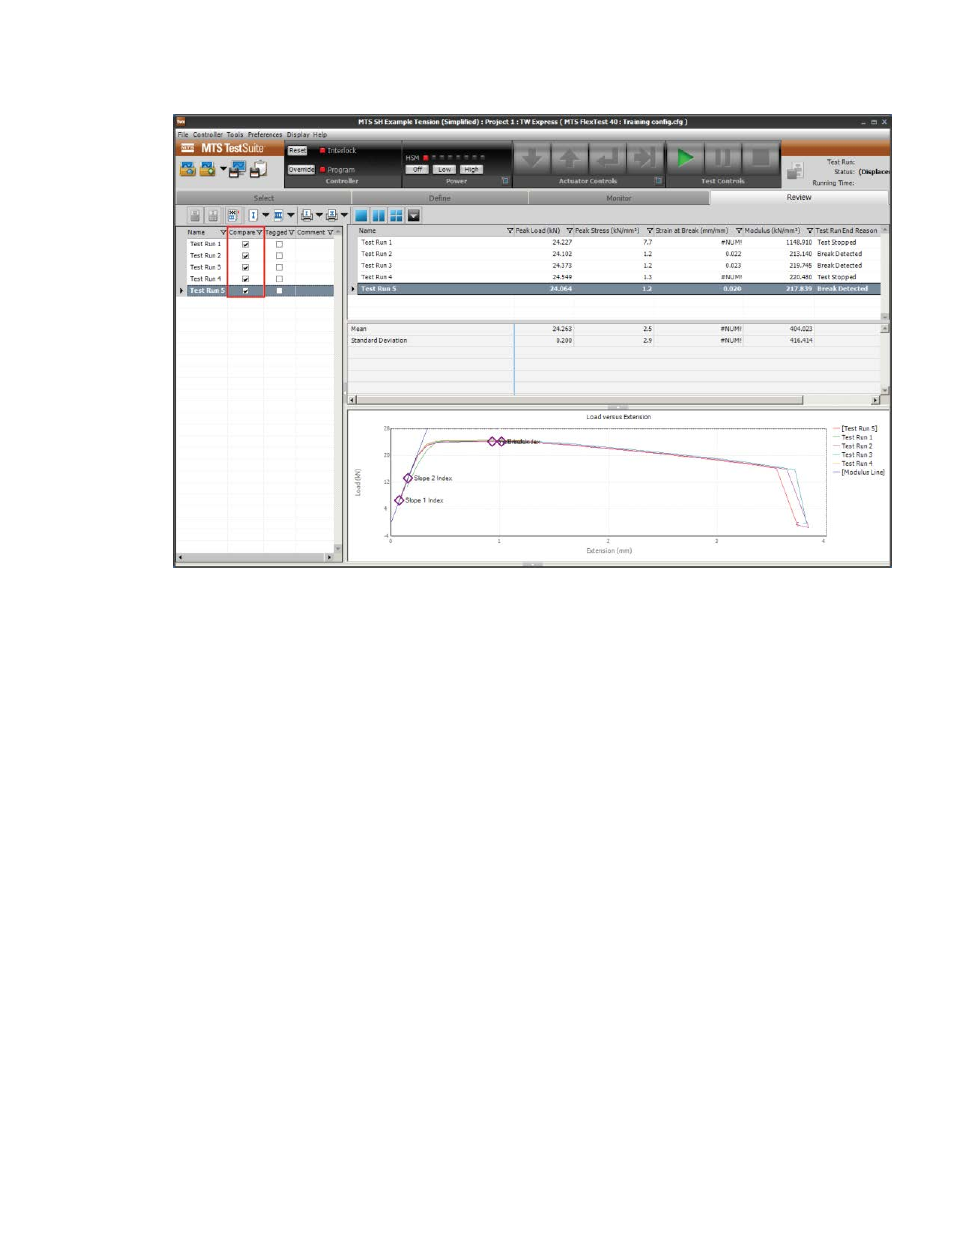
Upon opening the Review tab, only the selected test run is graphed. Compare all test runs on the same
graph by selecting the Compare check box next to each test run. Graphs for each test run are plotted
in the Load versus Extension panel.
4. Exclude invalid test runs.
In this example, Test Runs 1 and 4 had problems associated with them.
a) Exclude those two test runs from the statistical data by selecting the Tagged check box next to each
test run.
MTS Landmark Test System Operation | 121
Reviewing, Analyzing, and Reporting Data