Online measurement / data in form of a list – Amprobe PQ55A Power-Analyzer User Manual
Page 31
“Graph Range” area
The display area can be modified by direct input or using the arrow keys.
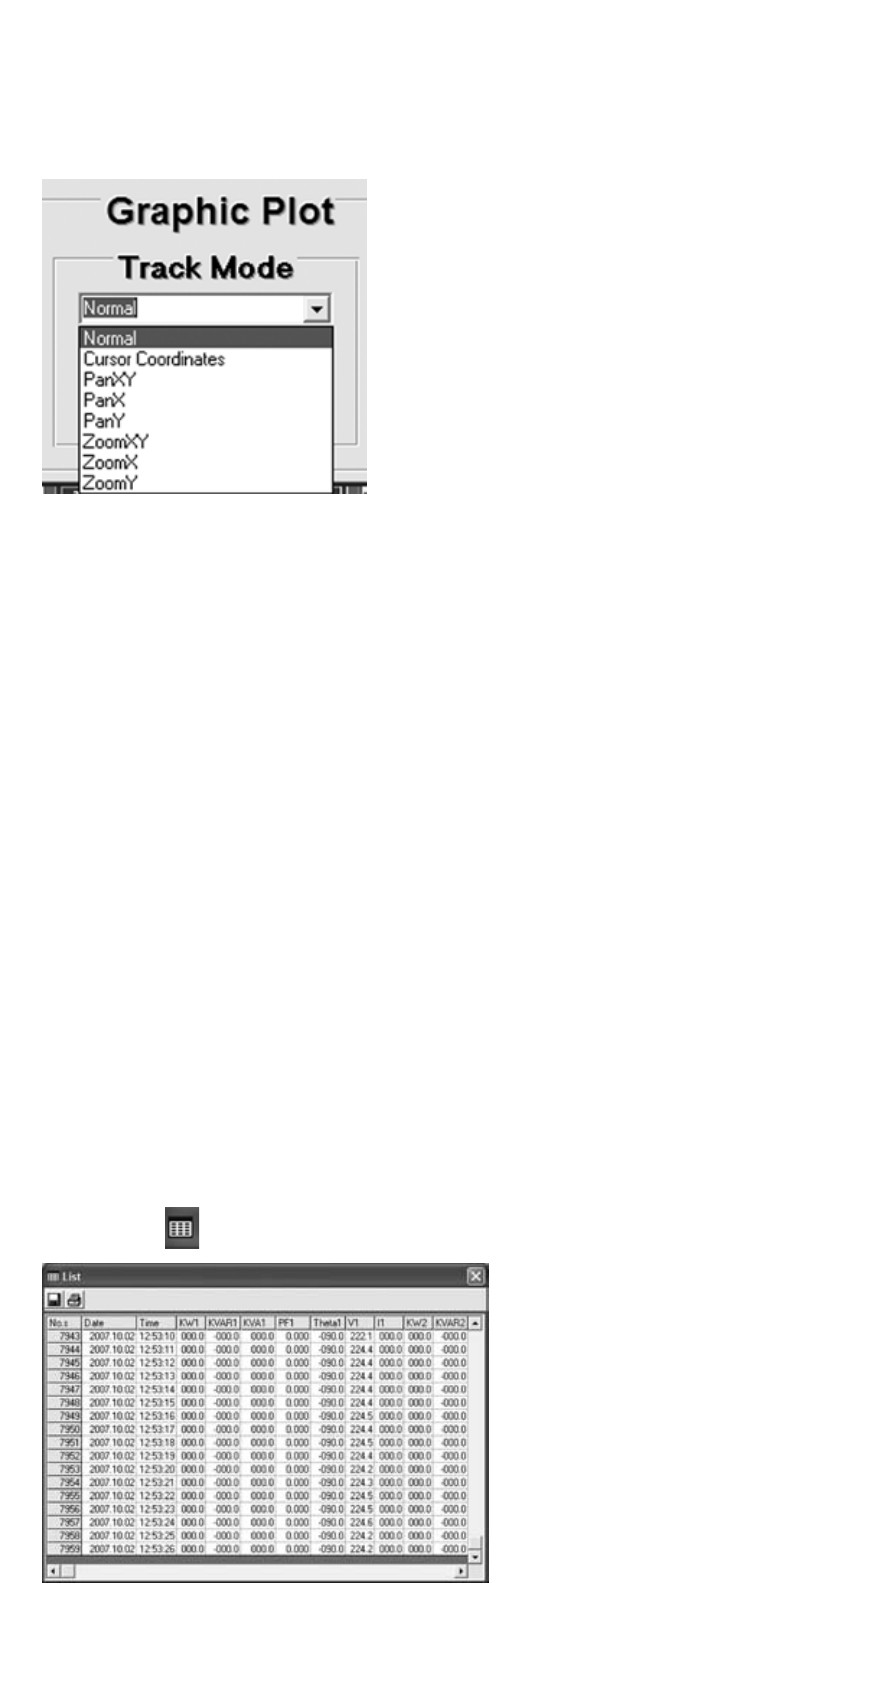
“Track Mode” area
Mouse functions for the graphic display
Normal:
no function
Cursor
Coordinates:
Cursor display with additional indication of the measured
value in the “Cursor Information” area.
PanXY:
Shifting the graph in X and Y direction
PanX:
Shifting the graph in X direction
PanY:
Shifting the graph in Y direction
Note:
To shift the graph, click the graph, keep the left mouse key
pressed and drag in the requested direction.
ZoomXY:
Zoom-up of the section: Enlargement of the X and Y axis.
ZoomX:
Zoom-up of the section: Enlargement of the X axis.
ZoomY:
Zoom-up of the section: Enlargement of the Y axis.
☞
Use the mouse to select the part of the graph to be zoomed up with a rect-
angle or border lines.
“Reset Scale” button:
Change back to the display of the complete diagram.
“Print Graph” button:
Print-out of the displayed diagram (screen).
☞
Saved data can be exported to external programs for further processing,
such as MS EXCEL.
Online measurement / data in form of a list
Click the (c) button to start the online measurement.
All input signals are listed in an
overall list with values.
Click the button to save these
listed measured values.
After having clicked the button,
the window for the entry of the
file name and of the path for the
measurement or measurements to
be saved will be displayed.
31