Amprobe PQ55A Power-Analyzer User Manual
Page 29
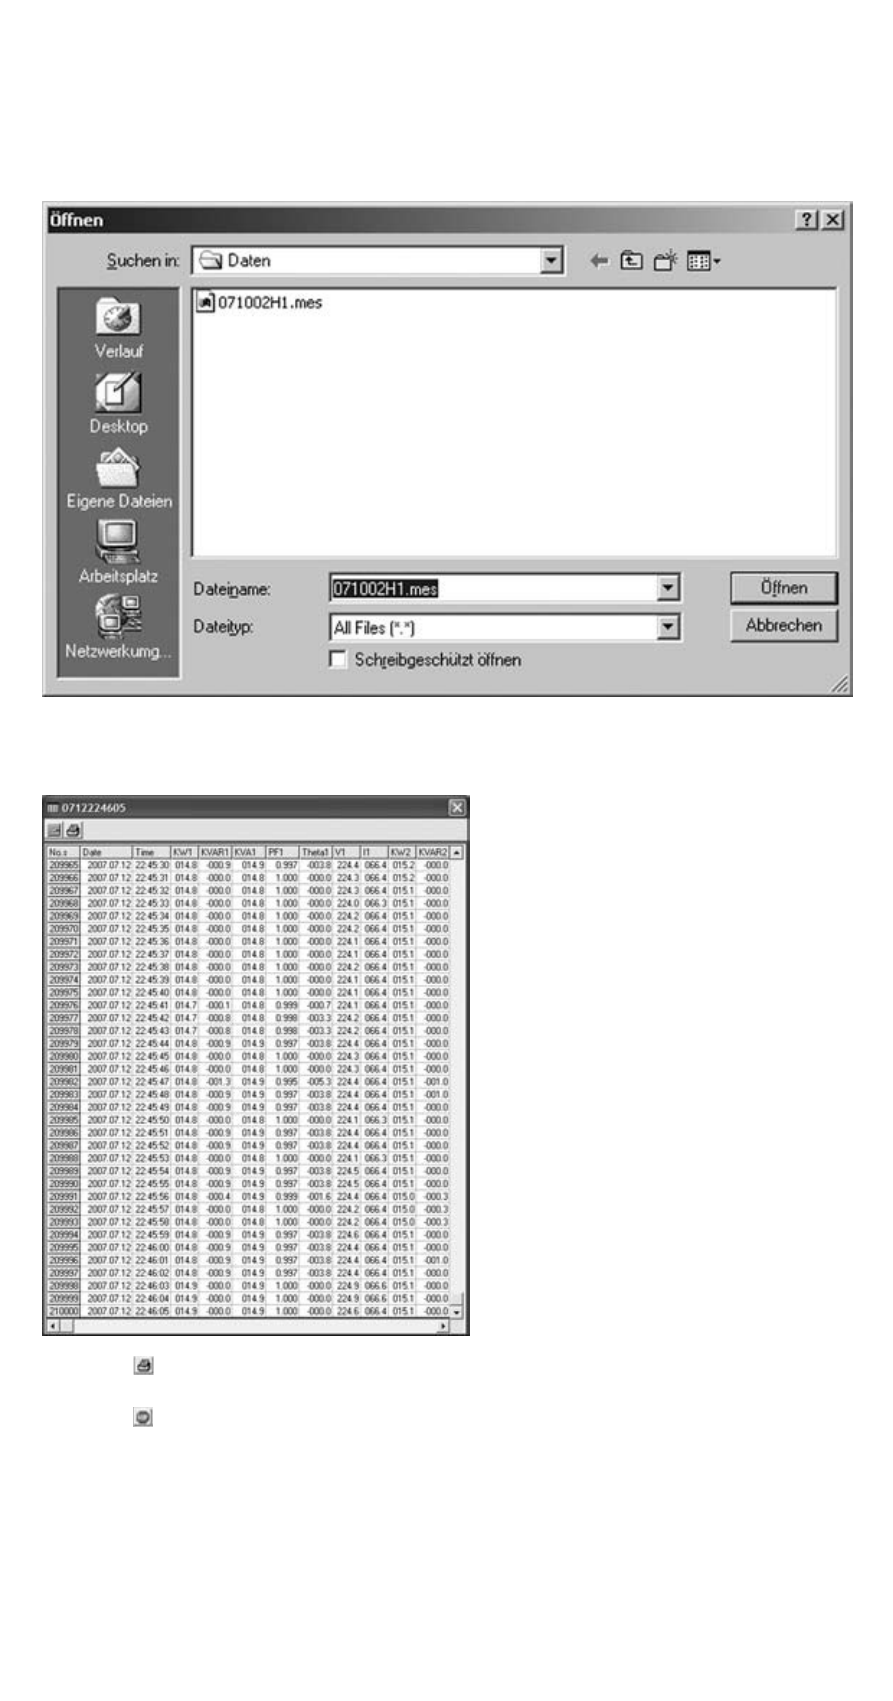
Opening file – Analysis of the data saved in the PC
By clicking the (b) [Insert graph] button, the saved measurements can be loaded.
After clicking on the button, the window for the selection of the file will appear.
After having selected the requested file, the saved data will be displayed in form
of a table.
Click the button to print the values in form of a table.
Click the button to change over to the graphical representation.
29
See also other documents in the category Amprobe Measuring instruments:
- AC71B Clamp-On-Multimeter (96 pages)
- AC50A (78 pages)
- ACD-10-TRMS-Pro (16 pages)
- AC68C Clamp-Multimeter (52 pages)
- ACD-14-TRMS-FX Clamp-On-Multimeter (19 pages)
- ACD-10-TRMS-PLUS ACD-10-PLUS Clamp-Multimeters (116 pages)
- ACD-40PQ Clamp-Meters (16 pages)
- ACD-23SW Digital-Clamp-Meters (20 pages)
- ACD-41PQ Clamp-On-Power-Meters (20 pages)
- ACD-41PQ Clamp-On-Power-Meters (121 pages)
- ACD-14-TRMS-PLUS Clamp-On-Multimeters (148 pages)
- ACD-330T Clamp-On-Multimeter (42 pages)
- ACD-21SWC Digital-Clamp-Meters (84 pages)
- ACD-4 Mini-Clamp-DMM (16 pages)
- ACD-6-TRMS-PRO Clamp-On-Multimeters (15 pages)
- FLASH-80 Industrial-Mini-Flashlight (98 pages)
- FLASH-80 Industrial-Mini-Flashlight (64 pages)
- FLASH-80 Industrial-Mini-Flashlight (46 pages)
- FLASH-80 Industrial-Mini-Flashlight (44 pages)
- ACD-50NAV ACD-51NAV ACDC-52NAV ACD-53NAV ACD-54NAV Navigator-Clamps (36 pages)
- ACD-55HPQ Clamp-Meter (62 pages)
- ACDC-620T Clamp-On-Multimeter (65 pages)
- ACDC-400 Digital-Clamp-On-Multimeter (98 pages)
- ACDC-100-TRMS Clamp-On-Multimeters (97 pages)
- RS-3 Rotary-Scale-Clamp-On (4 pages)
- AD105A Clamp-Meter (34 pages)
- LH41A Clamp-On-Ammeter (53 pages)
- 30XR-A Professional-Digital-Multimeter (53 pages)
- 33XR-A Professional-Digital-Multimeter (73 pages)
- 34XR-A Professional-Digital-Multimeter (73 pages)
- 37XR-A Professional-Digital-Multimeter (86 pages)
- 5XP-A 15XP-A 35XP-A Compact-Digital-Multimeters (126 pages)
- AM-110-TRMS Digital-Multimeters (15 pages)
- AM-160-A DMM (30 pages)
- 38XR-A Professional-Digital-Multimeter (92 pages)
- AM-33 Digital-Multimeter (1 page)
- AM-34 Auto-Digital-Multimeter (1 page)
- AM-47 Multimeters (8 pages)
- AM-240 Digital-Multimeters (75 pages)
- AM-250 Digital-Multimeter (22 pages)
- AM-270 Industrial-Multimeter (28 pages)
- AM-60 Compact-Digital-Multimeter (20 pages)
- AM8C Analog-Multimeter (66 pages)
- CR50A Capacitance-Resistance-Meter (46 pages)
- AM91RS Digital-Multimeter (30 pages)