Seaward PATGuard Time Manager User Manual
Page 10

Seaward Electronic Ltd PATGuard Time Manager 2 User Manual.
- 10 -
Rev. 1.3
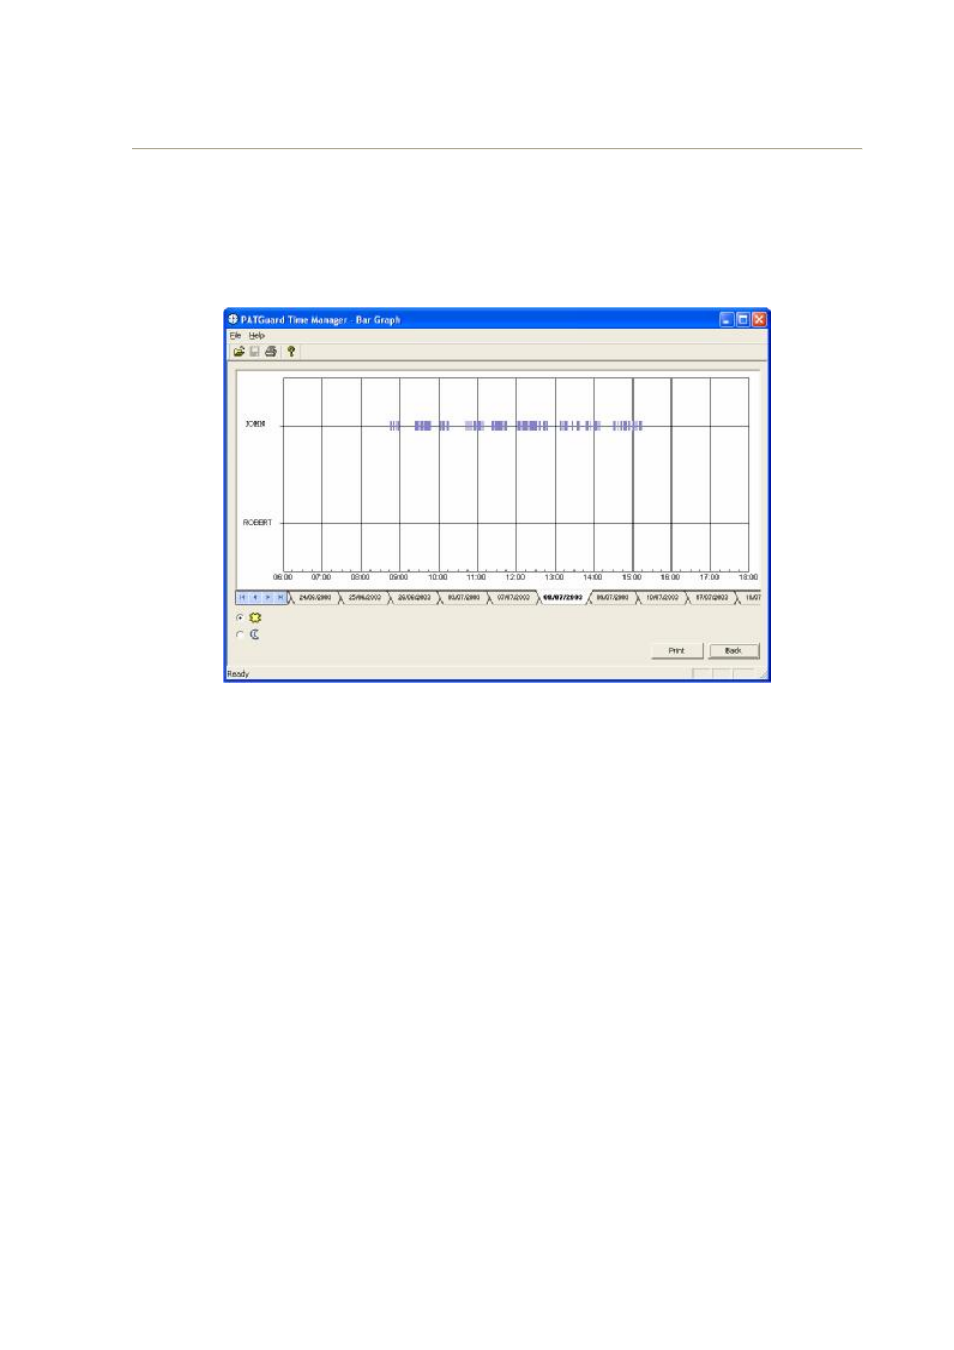
Bar Graph
The Bar Graph will give a clear visual indication of the time the tester was in use by individual Users.
The graph has a resolution of 2 minutes i.e. no test action for 2 minutes or more will show as a break in
the bar.
Fig 6: Typical Bar Graph window
Select Print to obtain a print out of the bar graph. Select Back to view the Test Data.
Save as File
The Test Data information can be saved as spreadsheet file (csv) to enable other data display options or to
save the selected data as a record.
At the Test Data window select Save as File so the following Save As dialog box is displayed. Save as
File can also be launched from the Save As icon or by selecting Save As from the File drop down while
the Test Data window is displayed. Choose a path and file name and select Save to create the file.
- AGL-5 (2 pages)
- Apollo 500 (21 pages)
- B433R (16 pages)
- Checkbox 17 Plus (4 pages)
- Apollo 600 (32 pages)
- B255 (40 pages)
- A203ES (10 pages)
- A252 (35 pages)
- DO4000 (22 pages)
- DO5000 Interface (41 pages)
- DO5000 Series (36 pages)
- DO7e (24 pages)
- DP6 (22 pages)
- DO7010 (44 pages)
- ARE 1557 (31 pages)
- Europa Pac Plus (53 pages)
- Supernova Elite (118 pages)
- HAL Scan (164 pages)
- G2000 (44 pages)
- IRT 1557 (21 pages)
- KD1E (22 pages)
- LLT (2 pages)
- PAC3760 (2 pages)
- PAC 1500Xi (12 pages)
- PAC 1000 (10 pages)
- PAT2000i (29 pages)
- PATGuard Elite Quick start (2 pages)
- PATGuard Elite SQL Quick start (2 pages)
- PATGuard Pro 2 (77 pages)
- PATguard Pro 2 Quick start (2 pages)
- PATGuard Work About Quick start (4 pages)
- PH3 LLT (6 pages)
- PATGuard Work About (53 pages)
- Solar Power Clamp (31 pages)
- PowerGuard Pro (29 pages)
- PowerPlus 1557 (62 pages)
- PowerPlus PC (44 pages)
- 100 PrimeTest (24 pages)
- PATGuard 3 (153 pages)
- 200 PrimeTest (34 pages)
- 250 PrimeTest (48 pages)
- 220 PrimeTest (34 pages)
- 50 PrimeTest (20 pages)
- RH9A Series (16 pages)
