Rpm (machine speed) plots, Waterfall plot, Rpm (m – Measurement Computing Medallion Rotate rev.2.3 User Manual
Page 46: Achine, Peed, Lots, Aterfall

46
Medallion Rotate Manual
October 2000
RPM (M
ACHINE
S
PEED
) P
LOTS
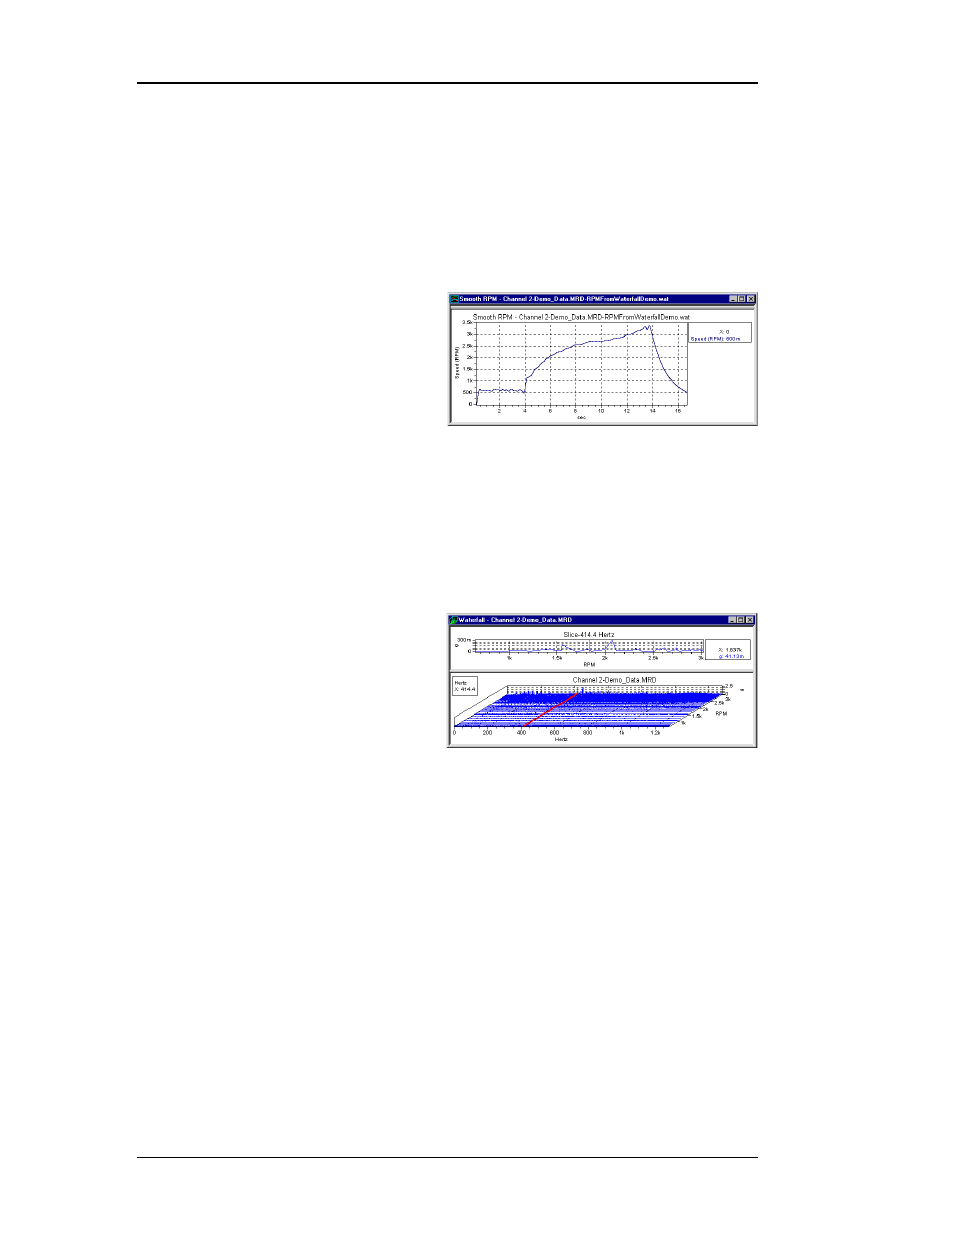
The plot below shows two RPM curves that display the instantaneous
speed of a machine. You create these curves by performing a Tachometer
analysis on a tachometer or other machine speed signal. See “Processing a
Tachometer Signal.” Medallion Rotate Plus can also create RPM curves without
a tachometer from a Waterfall plot of a data channel. See “RPM from Waterfall.”
To display calculated RPM files, do one of the following:
• You can display a calculated Raw RPM (rpm*.raw file) curve or a
Smooth RPM (smoothrpm*.spl)
curve by right-clicking the
channel in the Channel List
window an choosing Plot.
• You can display both curves
together (as shown above) by
selecting both channels, then right-clicking one and choosing Plot.
W
ATERFALL
P
LOT
The Waterfall plot displays multiple spectra as a function of position. You
create a Waterfall plot by performing a Waterfall analysis on data signal, or on
the combination of a data and a machine speed signal. See “Waterfall
Analysis.”
The Waterfall plot also shows an amplitude plot for the “slice” under the
cursor. You can display a waterfall by
right-clicking the waterfall file in the
Channel List window and choosing
Plot.
Hint: Medallion Rotate needs the
smoothed RPM file to display
the waterfall in orders.
• Select both the Waterfall (waterfall*.wat) and the Smooth RPM
(smoothrpm*.spl) channels in the Channel List window. Then right-click
one and choose Plot.
• If you have already displayed a Waterfall plot, you can drag and drop
the Smooth RPM (smoothrpm*.spl) channel from the Channel List
window onto the Waterfall plot. Medallion Rotate recalculates the
waterfall using the smoothed speed curve.
