Waterfall analysis, Aterfall, Nalysis – Measurement Computing Medallion Rotate rev.2.3 User Manual
Page 25

October 2000
Medallion Rotate Manual
25
W
ATERFALL
A
NALYSIS
You can perform a Waterfall analysis
on time waveform data from any
transducer. The data transducer can be a
vibration sensor (accelerometer, velocity
sensor, non-contact probe) or any other
meaningful sensor (temperature,
thickness, pressure, …).
You can use Waterfall analysis on a
data channel without a machine speed signal; however, you will not be able to
use the machine speed or order tracking
capabilities of the Waterfall plot. If you
have a tachometer signal you can create
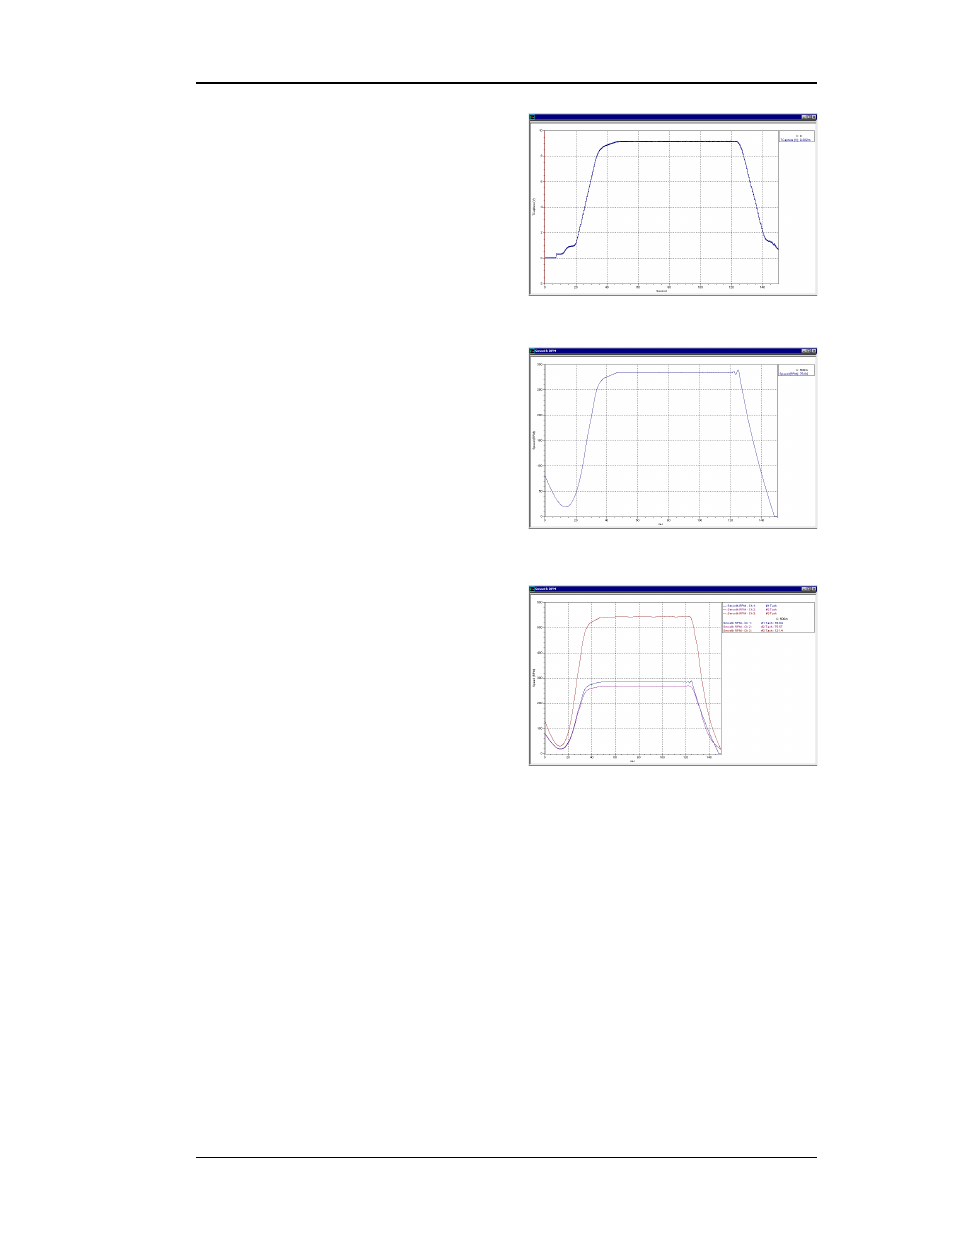
the smooth speed curve as described in
“Processing a Tachometer Signal.” Then
you can combine the speed curve with
data from a correlated transducer in the
Waterfall analysis.
The result of the Waterfall analysis is
a series of spectra displayed on a three-dimensional (X-Y-Z) plot. The Waterfall
plot provides several useful ways of
looking at the data:
• The plot cursors can track the X
axis or the Z axis.
• You can choose frequency or
orders for the X axis and X axis
cursors.
• You can choose spectrum number,
RPM, or seconds for the Z axis and Z axis cursors. If you use order
normalization, you can also choose the number of revolutions for the Z
axis.
• You can display the data in a traditional spectral Waterfall plot, or as a
Color Contour plot. See “Contour Plot.”
Medallion Rotate can also order normalize the data so that the order-related
peaks line up exactly on the orders (when the X axis is in orders). See “Order
Normalization.”
