Example, Theory, Xample – Measurement Computing Medallion Rotate rev.2.3 User Manual
Page 40: Heory

40
Medallion Rotate Manual
October 2000
• More spectral lines are required for the Millstrum analysis, since the
analysis reduces the number of lines in the result by half. Collect a large
number of sample points, and use the largest possible blocksize for the
signal. This is explained in the section on “Theory” below.
• The choice of window function for analysis depends on the type of
resolution you need (amplitude or frequency resolution). If you are
using order normalization, the Hanning window is a good choice. The
Uniform window is only a good choice when the orders are integer
multiples of the shaft speed (1x, 2x, 3x, …).
E
XAMPLE
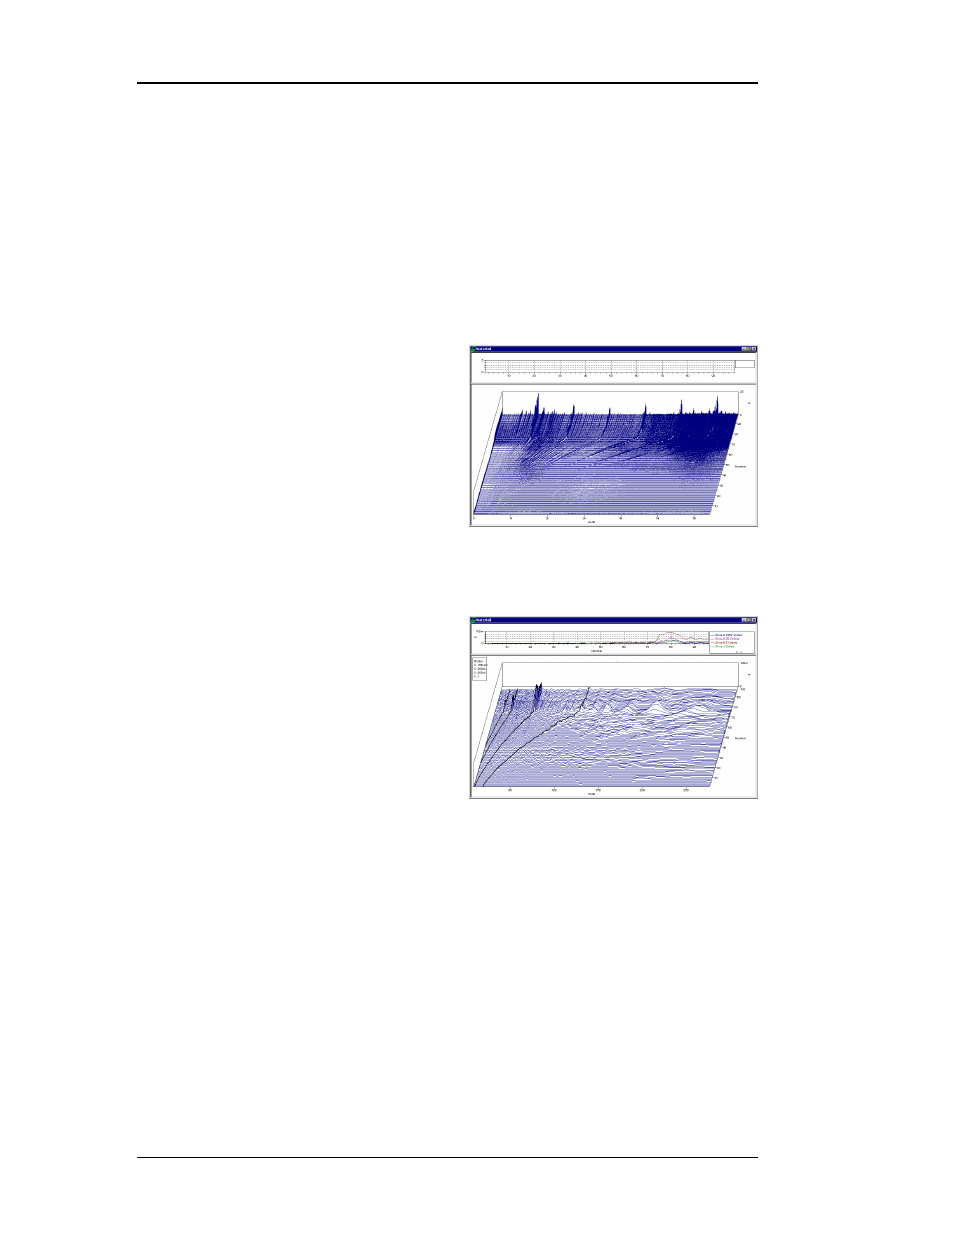
This example is from an automotive
dynamometer. The first Waterfall plot does
not use Millstrum analysis. Notice the
large number of peaks, and the difficulty in
sorting out the harmonics.
The second Waterfall plot is the result
of the Millstrum analysis. Note that the
peaks show the forcing and the harmonic
frequencies. Remember that the X axis, while in Hz, is not the same as the X axis
in the first Waterfall plot. Instead, you can read the forcing and harmonic
frequencies directly from the X axis.
To use Millstrum analysis, follow
these steps:
1. In the Channel List window, select
the data channel (and a
corresponding smoothed machine
speed curve if desired). Then click
the Waterfall analysis button.
2. In the Waterfall analysis dialog
box, select Millstrum for the Window cor.
3. Select the other desired parameters and choose OK to create the
Millstrum plot.
T
HEORY
A simple analogy is that Millstrum analysis looks at the spectrum as if it
were a time waveform, and attempts to identify periodic repeating events in the
spectrum. In other words, it takes the FFT of the FFT spectrum. Since both
harmonics and sidebands are periodic repeating peaks in a spectrum, they show
up in the Millstrum as single peaks. The “frequencies” of the peaks in the
Millstrum are the frequencies of the repeating events.
