Tds versus temperature chart – Hanna Instruments HI 8633 User Manual
Page 14
14
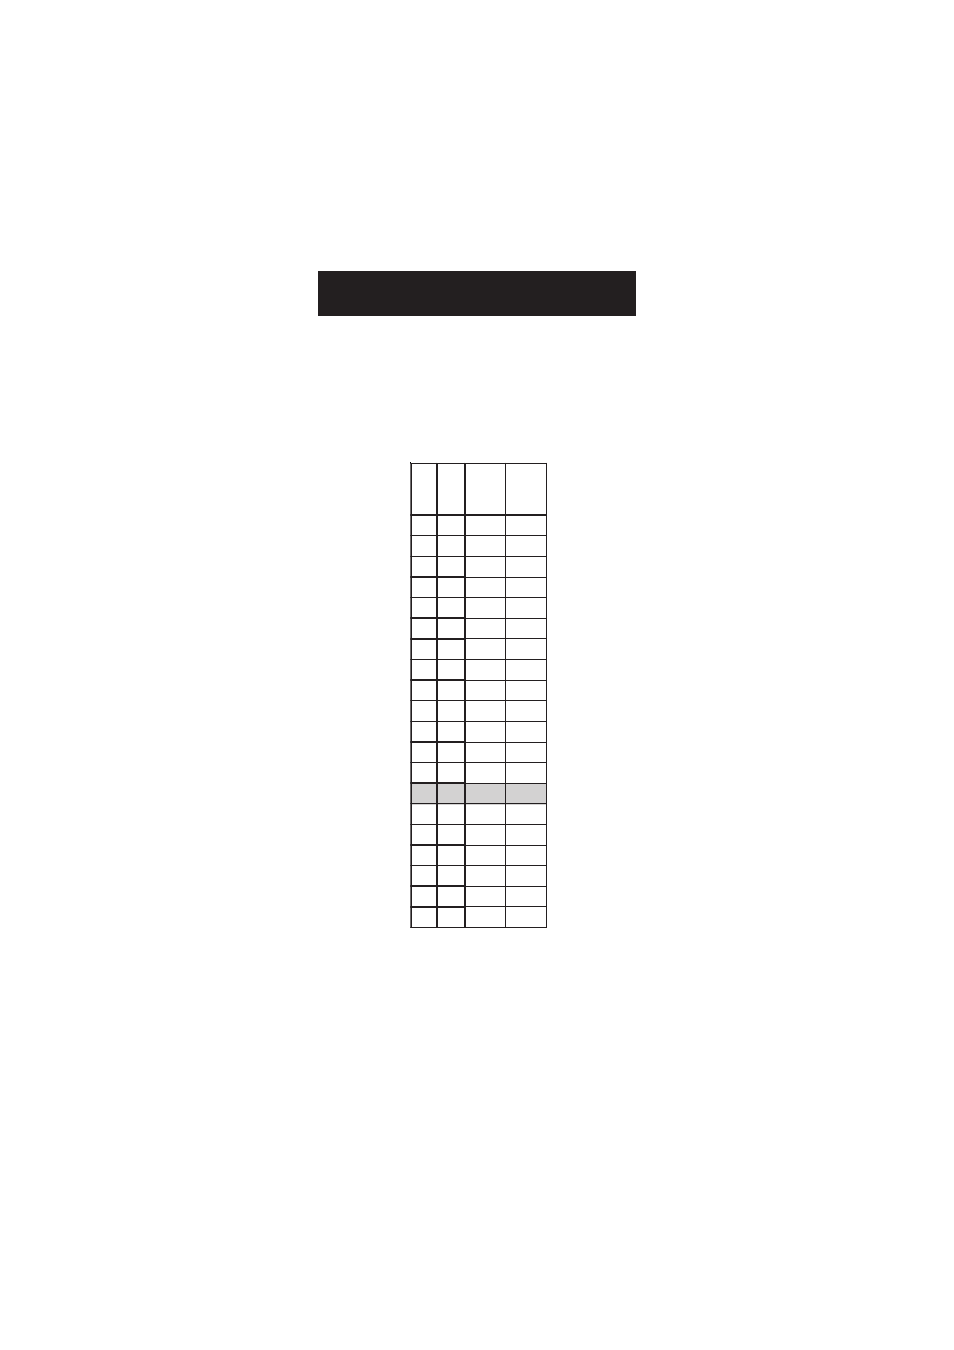
The TDS value in aqueous solutions is directly proportional to
conductivity. The ratio between the two parameters depends on the
solution and usually it is set to a factor of 0.5 (corresponding to a
solution of CaCO
3
). This means that 1
µ
S/cm is equal to 0.5 mg/L
(ppm) of TDS.
For manual temperature compensation, refer to the following chart:
For instance, the TDS values of the calibration solutions at 25°C are
1382 mg/L or 12.41 g/L when using
HI 7032 or HI 7036,
respectively.
At 20°C, the values are 1251 mg/L or 11.24 g/L, respectively.
With the solutions at 30°C, the values are 1515 mg/L or 13.61 g/L,
respectively.
C
º
F
º
2
3
0
7
I
H
L
/
g
m
)
m
p
p
(
6
3
0
7
I
H
L
/
g
)t
p
p
(
0
2
3
8
5
7
2
8
.
6
5
1
4
6
7
8
8
8
.
7
0
1
0
5
9
9
9
9
9
.
8
5
1
9
5
2
2
1
1
0
1
.
0
1
6
1
8
.
0
6
8
4
1
1
3
3
.
0
1
7
1
6
.
2
6
3
7
1
1
6
5
.
0
1
8
1
4
.
4
6
0
0
2
1
8
7
.
0
1
9
1
2
.
6
6
4
2
2
1
1
0
.
1
1
0
2
8
6
1
5
2
1
4
2
.
1
1
1
2
8
.
9
6
7
7
2
1
7
4
.
1
1
2
2
6
.
1
7
3
0
3
1
1
7
.
1
1
3
2
4
.
3
7
9
2
3
1
4
9
.
1
1
4
2
2
.
5
7
8
5
3
1
8
1
.
2
1
5
2
7
7
2
8
3
1
1
4
.
2
1
6
2
8
.
8
7
8
0
4
1
5
6
.
2
1
7
2
6
.
0
8
8
3
4
1
9
8
.
2
1
8
2
4
.
2
8
1
6
4
1
3
1
.
3
1
9
2
2
.
4
8
6
7
4
1
7
3
.
3
1
0
3
6
8
5
1
5
1
1
6
.
3
1
1
3
8
.
7
8
1
4
5
1
5
8
.
3
1
TDS VERSUS
TEMPERATURE CHART