Conductivity versus temperature chart – Hanna Instruments HI 8633 User Manual
Page 13
13
The conductivity of an aqueous solution is the measure of its ability to
carry an electrical current by means of ionic motion.
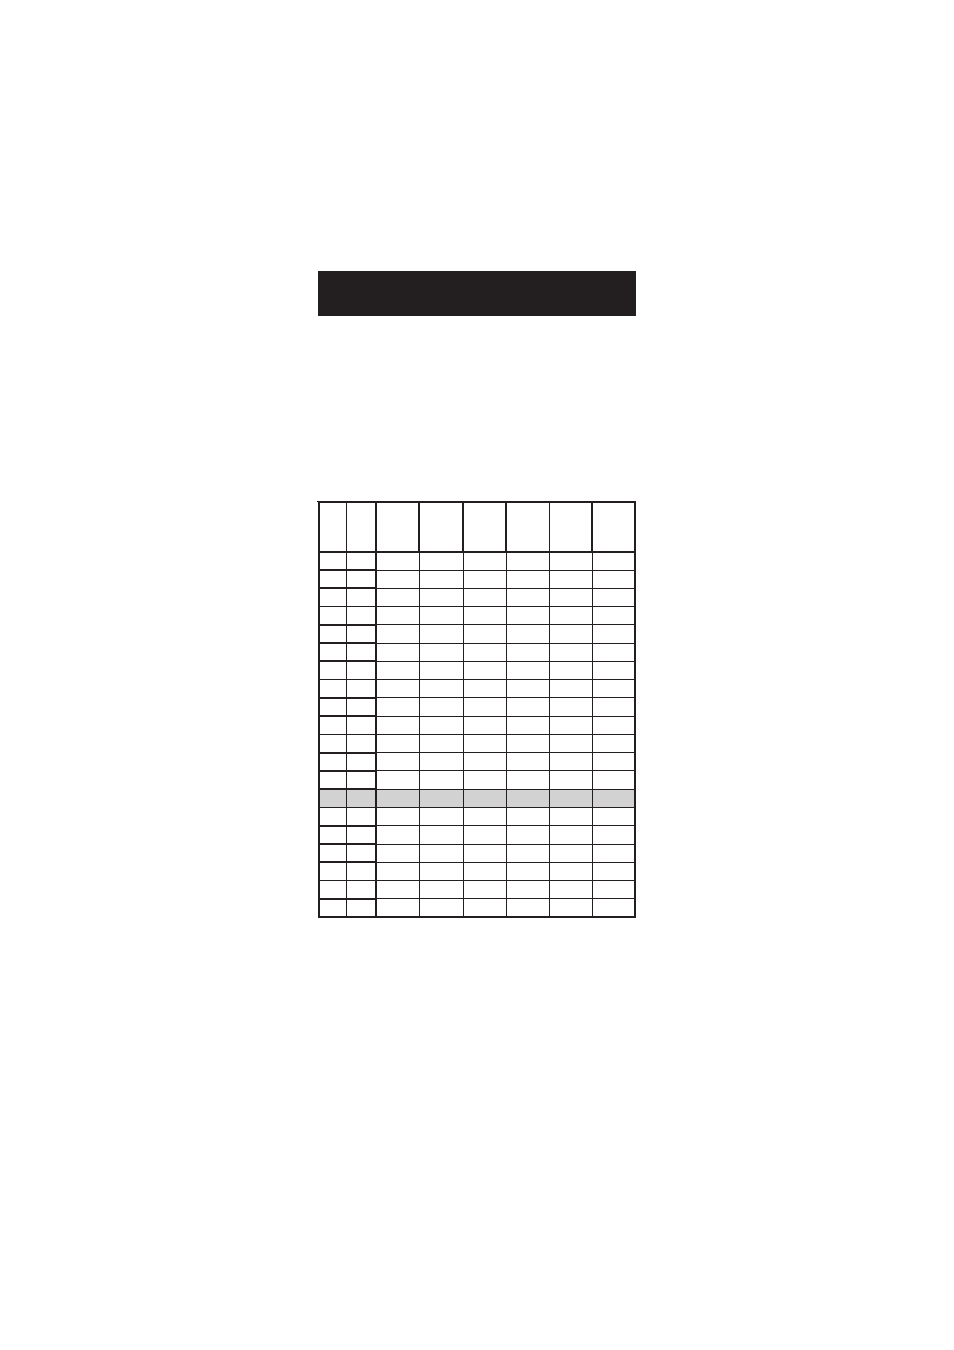
The conductivity invariably increases with increasing temperature.
It is affected by the type and number of ions in the solution and by
the viscosity of the solution itself. Both parameters are temperature
dependent. The dependency of conductivity on temperature is
expressed as a relative change per degree Celsius at a particular
temperature, commonly as percent per °C.
For manual temperature compensation, refer to the following chart:
For instance, the conductivity values of the calibration solutions at
25°C are 12880
µ
S/cm, 1413
µ
S/cm or 5000
µ
S/cm when using
HI 7030, HI 7031 or HI 7039, respectively.
At 20°C, the values are 11670
µ
S/cm, 1278
µ
S/cm or
4523
µ
S/cm, respectively.
With the solutions at 30°C, the values are 14120
µ
S/cm, 1548
µ
S/cm
or 5479
µ
S/cm, respectively.
C
º
F
º
0
3
0
7
I
H
0
3
0
8
I
H
(
µ
)
m
c
/
S
1
3
0
7
I
H
1
3
0
8
I
H
(
µ
)
m
c
/
S
3
3
0
7
I
H
3
3
0
8
I
H
(
µ
)
m
c
/
S
4
3
0
7
I
H
4
3
0
8
I
H
(
µ
)
m
c
/
S
5
3
0
7
I
H
5
3
0
8
I
H
(
µ
)
m
c
/
S
9
3
0
7
I
H
9
3
0
8
I
H
(
µ
)
m
c
/
S
0
2
3
0
5
1
7
6
7
7
4
6
0
0
3
8
4
0
0
4
5
6
0
6
7
2
5
1
4
0
2
2
8
6
9
8
5
6
0
0
5
3
5
0
0
1
4
7
0
8
1
3
0
1
0
5
0
3
3
9
0
2
0
1
7
6
0
0
6
9
5
0
0
2
3
8
5
1
6
3
5
1
9
5
0
8
4
0
1
7
4
1
1
8
6
0
0
4
5
6
0
0
5
2
9
3
6
0
4
6
1
8
.
0
6
0
2
7
0
1
3
7
1
1
0
7
0
0
2
7
6
0
0
4
4
9
5
5
1
4
7
1
6
.
2
6
0
5
9
0
1
9
9
1
1
1
7
0
0
5
8
6
0
0
3
6
9
5
4
2
4
8
1
4
.
4
6
0
9
1
1
1
5
2
2
1
3
7
0
0
8
9
6
0
0
2
8
9
7
3
3
4
9
1
2
.
6
6
0
3
4
1
1
1
5
2
1
4
7
0
0
3
1
7
0
0
2
0
0
1
9
2
4
4
0
2
8
6
0
7
6
1
1
8
7
2
1
6
7
0
0
4
2
7
0
0
1
2
0
1
3
2
5
4
1
2
8
.
9
6
0
1
9
1
1
5
0
3
1
8
7
0
0
0
4
7
0
0
0
4
0
1
7
1
6
4
2
2
6
.
1
7
0
5
1
2
1
2
3
3
1
9
7
0
0
2
5
7
0
0
9
5
0
1
1
1
7
4
3
2
4
.
3
7
0
9
3
2
1
9
5
3
1
1
8
0
0
5
6
7
0
0
9
7
0
1
5
0
8
4
4
2
2
.
5
7
0
4
6
2
1
6
8
3
1
2
8
0
0
3
8
7
0
0
8
9
0
1
2
0
9
4
5
2
7
7
0
8
8
2
1
3
1
4
1
4
8
0
0
0
0
8
0
0
8
1
1
1
0
0
0
5
6
2
8
.
8
7
0
3
1
3
1
0
4
4
1
6
8
0
0
3
1
8
0
0
8
3
1
1
6
9
0
5
7
2
6
.
0
8
0
7
3
3
1
7
6
4
1
7
8
0
0
0
3
8
0
0
7
5
1
1
0
9
1
5
8
2
4
.
2
8
0
2
6
3
1
4
9
4
1
9
8
0
0
9
4
8
0
0
7
7
1
1
6
8
2
5
9
2
2
.
4
8
0
7
8
3
1
1
2
5
1
0
9
0
0
3
6
8
0
0
7
9
1
1
3
8
3
5
0
3
6
8
0
2
1
4
1
8
4
5
1
2
9
0
0
2
8
8
0
0
8
1
2
1
9
7
4
5
1
3
8
.
7
8
0
7
3
4
1
5
7
5
1
4
9
0
0
0
0
9
0
0
9
3
2
1
5
7
5
5
CONDUCTIVITY VERSUS
TEMPERATURE CHART