Hanna Instruments HI9126 User Manual
Page 8
14
15
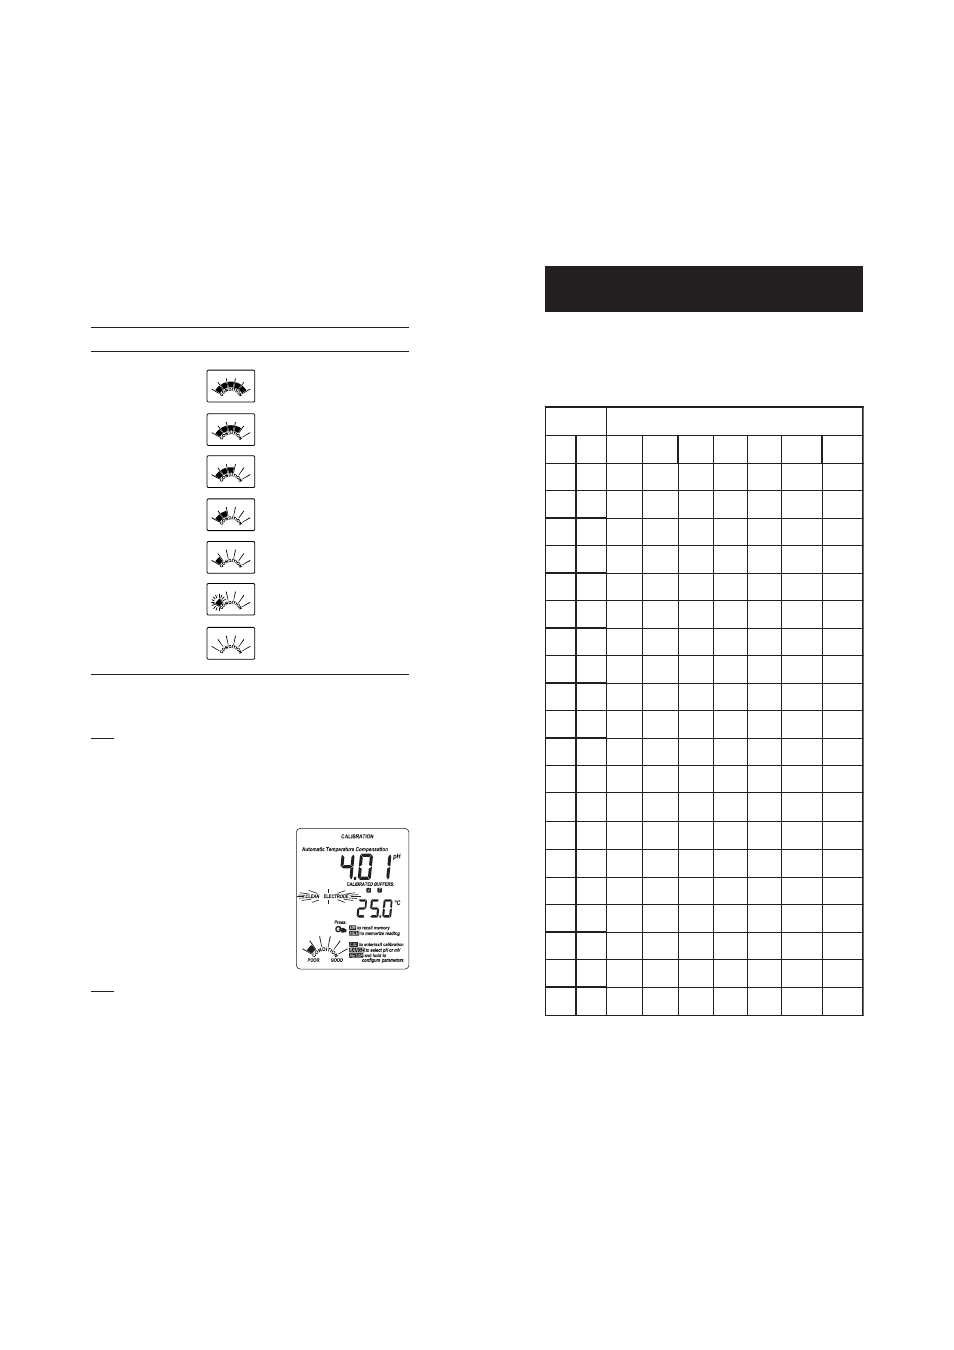
The temperature has an effect on pH. The calibration buffer solutions
are affected by temperature changes to a lesser degree than normal
solutions. During calibration the instrument will automatically calibrate
to the pH value corresponding to the measured or set temperature.
During calibration the instrument will display the pH buffer value at
25 °C.
p
pp
pp H BUFFER TEMPERATURE
H B U F F E R T E M P E R A T U R E
H B U F F E R T E M P E R A T U R E
H B U F F E R T E M P E R A T U R E
H B U F F E R T E M P E R A T U R E
D E P E N D E N C E
D E P E N D E N C E
D E P E N D E N C E
D E P E N D E N C E
D E P E N D E N C E
P
M
E
T
S
R
E
F
F
U
B
H
p
C
º
F
º
8
6
.
1
1
0
.
4
6
8
.
6
1
0
.
7
8
1
.
9
1
0
.
0
1
5
4
.
2
1
0
2
3
7
6
.
1
1
0
.
4
8
9
.
6
3
1
.
7
6
4
.
9
2
3
.
0
1
8
3
.
3
1
5
1
4
7
6
.
1
0
0
.
4
5
9
.
6
0
1
.
7
9
3
.
9
4
2
.
0
1
8
1
.
3
1
0
1
0
5
7
6
.
1
0
0
.
4
2
9
.
6
7
0
.
7
3
3
.
9
8
1
.
0
1
9
9
.
2
1
5
1
9
5
7
6
.
1
0
0
.
4
0
9
.
6
5
0
.
7
7
2
.
9
2
1
.
0
1
0
8
.
2
1
0
2
8
6
8
6
.
1
0
0
.
4
8
8
.
6
3
0
.
7
2
2
.
9
6
0
.
0
1
2
6
.
2
1
5
2
7
7
8
6
.
1
1
0
.
4
6
8
.
6
1
0
.
7
8
1
.
9
1
0
.
0
1
5
4
.
2
1
0
3
6
8
8
6
.
1
2
0
.
4
5
8
.
6
0
0
.
7
4
1
.
9
6
9
.
9
9
2
.
2
1
5
3
5
9
9
6
.
1
3
0
.
4
4
8
.
6
9
9
.
6
1
1
.
9
2
9
.
9
3
1
.
2
1
0
4
4
0
1
9
6
.
1
4
0
.
4
4
8
.
6
8
9
.
6
7
0
.
9
8
8
.
9
8
9
.
1
1
5
4
3
1
1
0
7
.
1
5
0
.
4
3
8
.
6
8
9
.
6
4
0
.
9
5
8
.
9
3
8
.
1
1
0
5
2
2
1
1
7
.
1
6
0
.
4
3
8
.
6
8
9
.
6
1
0
.
9
2
8
.
9
0
7
.
1
1
5
5
1
3
1
2
7
.
1
8
0
.
4
4
8
.
6
8
9
.
6
9
9
.
8
9
7
.
9
7
5
.
1
1
0
6
0
4
1
2
7
.
1
9
0
.
4
4
8
.
6
8
9
.
6
7
9
.
8
7
7
.
9
4
4
.
1
1
5
6
9
4
1
3
7
.
1
1
1
.
4
4
8
.
6
9
9
.
6
5
9
.
8
6
7
.
9
2
3
.
1
1
0
7
8
5
1
4
7
.
1
2
1
.
4
5
8
.
6
9
9
.
6
3
9
.
8
5
7
.
9
1
2
.
1
1
5
7
7
6
1
6
7
.
1
4
1
.
4
6
8
.
6
0
0
.
7
1
9
.
8
4
7
.
9
0
1
.
1
1
0
8
6
7
1
7
7
.
1
6
1
.
4
7
8
.
6
1
0
.
7
9
8
.
8
4
7
.
9
0
0
.
1
1
5
8
5
8
1
8
7
.
1
7
1
.
4
7
8
.
6
2
0
.
7
7
8
.
8
4
7
.
9
1
9
.
0
1
0
9
4
9
1
9
7
.
1
9
1
.
4
8
8
.
6
3
0
.
7
5
8
.
8
5
7
.
9
2
8
.
0
1
5
9
3
0
2
1
8
.
1
0
2
.
4
9
8
.
6
4
0
.
7
3
8
.
8
6
7
.
9
3
7
.
0
1
CONDITION
The display is provided with a 5-dot bargraph (unless disabled)
which gives an indication of the electrode status after calibration:
Bargraph indication
Condition value
All 5 dots steady
81 to 100% of life
4 dots steady
61 to 80%
3 dots steady
41 to 60%
2 dots steady
21 to 40%
1 dot steady
1 to 20%
1 dot blinking
0%
Only frame is ON
No info available
The “condition” bargraph remains active for 12 hours after calibration,
then only the frame is shown.
Note:
When an abnormal condition in the RTC is detected, the “condition”
is cleared and only the bargraph frame is shown on the display.
CLEAN ELECTRODE
Each time pH calibration is performed, the meter internally compares
the new calibration with the one previously stored.
When this comparison indicates a significant
difference, the “CLEAN ELECTRODE”
message blinks on the LCD to advise the
user that the pH electrode may need to
be cleaned (see “Electrode Conditioning &
Maintenance” section).
After cleaning, perform calibration.
Note:
If the calibration data are cleared, the comparison is done
with the default values.