Thermal considerations, Thermal curves, Thermal testing setup – Delta Electronics Q48DR User Manual
Page 12: Thermal derating, Figure 26: wind tunnel test setup, 48v(transverse orientation)
DS_Q48DR1R533_03152007
Note: Wind Tunnel Test Setup Figure Dimensions are in millimeters and (Inches)
THERMAL CONSIDERATIONS
Thermal management is an important part of the
system design. To ensure proper, reliable operation,
sufficient cooling of the power module is needed over
the entire temperature range of the module. Convection
cooling is usually the dominant mode of heat transfer.
Hence, the choice of equipment to characterize the
thermal performance of the power module is a wind
tunnel.
Thermal Testing Setup
Delta’s DC/DC power modules are characterized in
heated vertical wind tunnels that simulate the thermal
environments encountered in most electronics
equipment. This type of equipment commonly uses
vertically mounted circuit cards in cabinet racks in which
the power modules are mounted.
The following figure shows the wind tunnel
characterization setup. The power module is mounted
on a test PWB and is vertically positioned within the
wind tunnel. The space between the neighboring PWB
and the top of the power module is constantly kept at
6.35mm (0.25’’).
Thermal Derating
Heat can be removed by increasing airflow over the
module. The module’s hottest spot is less than + 120°C.
To enhance system reliability, the power module should
always be operated below the maximum operating
temperature. If the temperature exceeds the maximum
module temperature, reliability of the unit may be
affected.
12.7 (0.5”)
MODULE
AIR FLOW
50.8 (2.0”)
FACING PWB
PWB
AIR VELOCITY
AND AMBIENT
TEMPERATURE
MEASURED BELOW
THE MODULE
Figure 26: Wind tunnel test setup
13
THERMAL CURVES
Figure 27: Hot spot temperature measured point
*The allowed maximum hot spot temperature is defined at 120℃
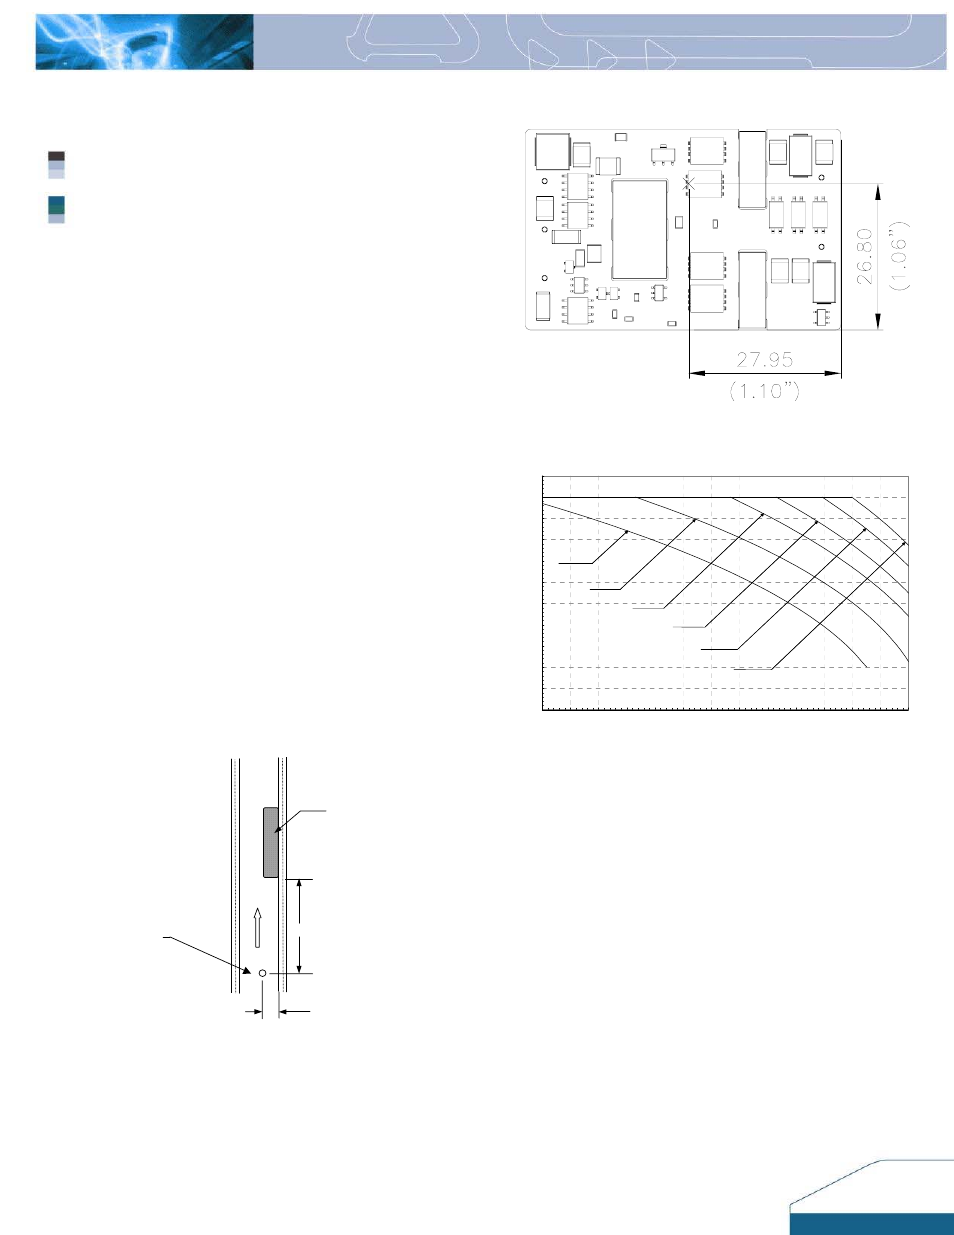
Q48DR1R533(standard) Output Load vs. Ambient Temperature and Air Velocity
@Vin = 48V (Transverse Orientation)
0%
10%
20%
30%
40%
50%
60%
70%
80%
90%
100%
110%
20
25
30
35
40
45
50
55
60
65
70
75
80
85
Ambient Temperature (℃)
Output Load(%)
Natural
Convection
100LFM
200LFM
300LFM
500LFM
400LFM
Figure 28: Output load vs. ambient temperature and air velocity
@V
in
=48V(Transverse Orientation)