Figure 2 figure 1 – USL PCA-100 User Manual
Page 5
PCA
I
NSTRUCTION
M
ANUAL
Ultra Stereo Labs, Inc.
- 4 -
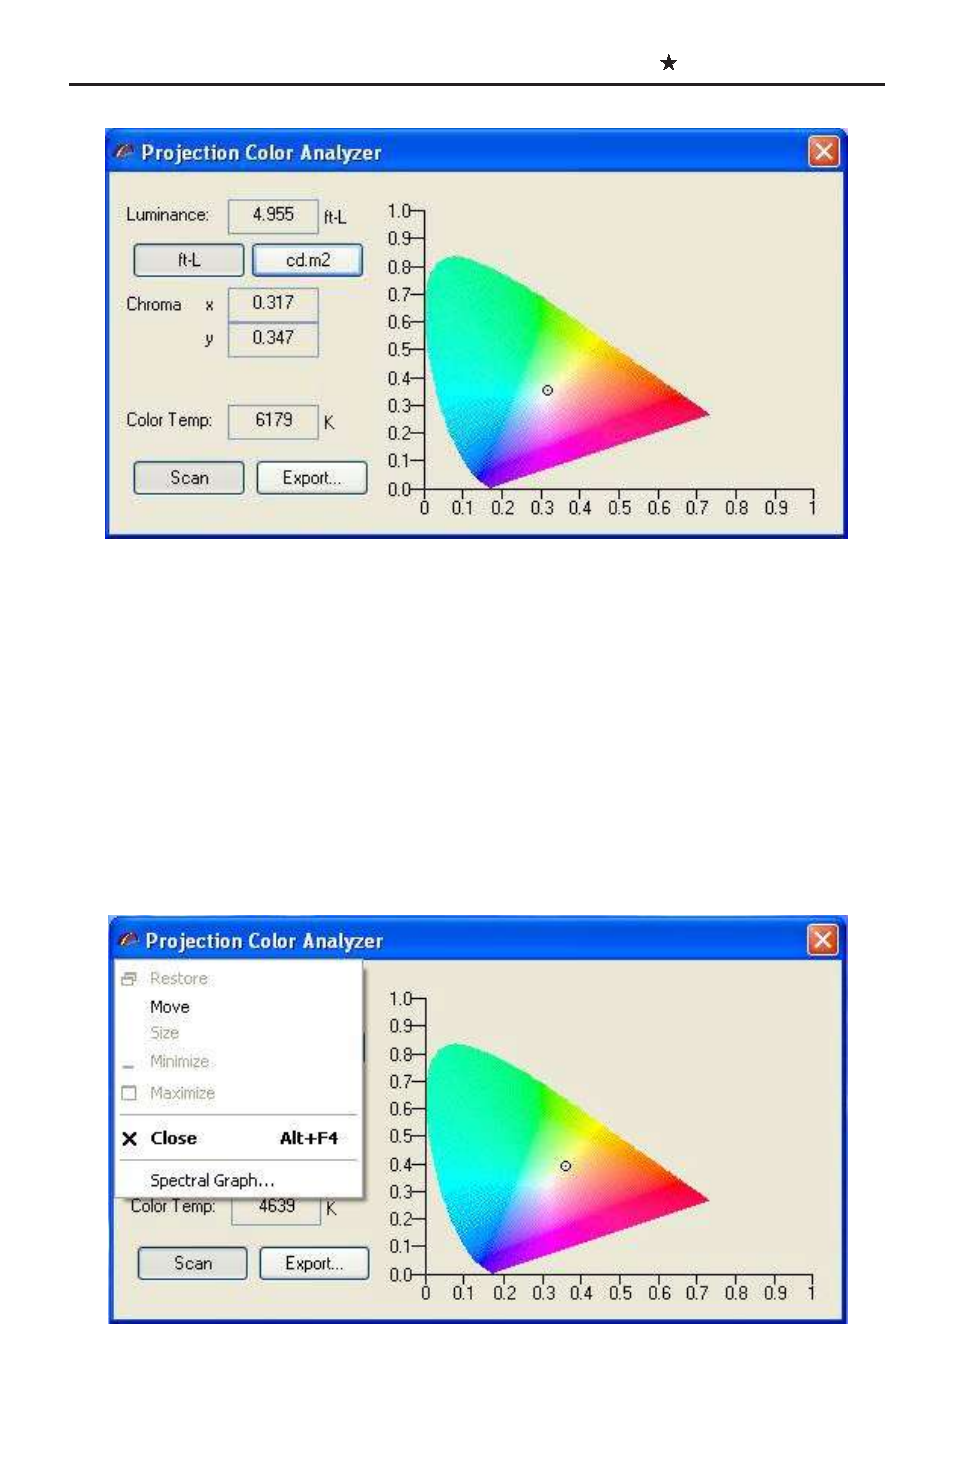
Luminance values can be shown in either foot-Lamberts or candelas per
square meter. The choice is made by clicking on either button below the
luminance value box.
A spectral graph of the light seen by the Color Analyzer is shown in figure
three. This graphical representation can be displayed by first clicking on the
small rainbow icon in the upper left-hand corner of the laptop display and then
on the spectral graph option as shown in figure two.
The horizontal axis displays color wavelength in nanometers and the vertical
axis indicates relative amplitude of the spectral components in arbitrary units.
Figure 2
Figure 1