Operator’s manual, Screen layout – ANKOM RF User Manual
Page 20
Operator’s Manual
pg. 20
Rev F 8/29/14
Screen layout
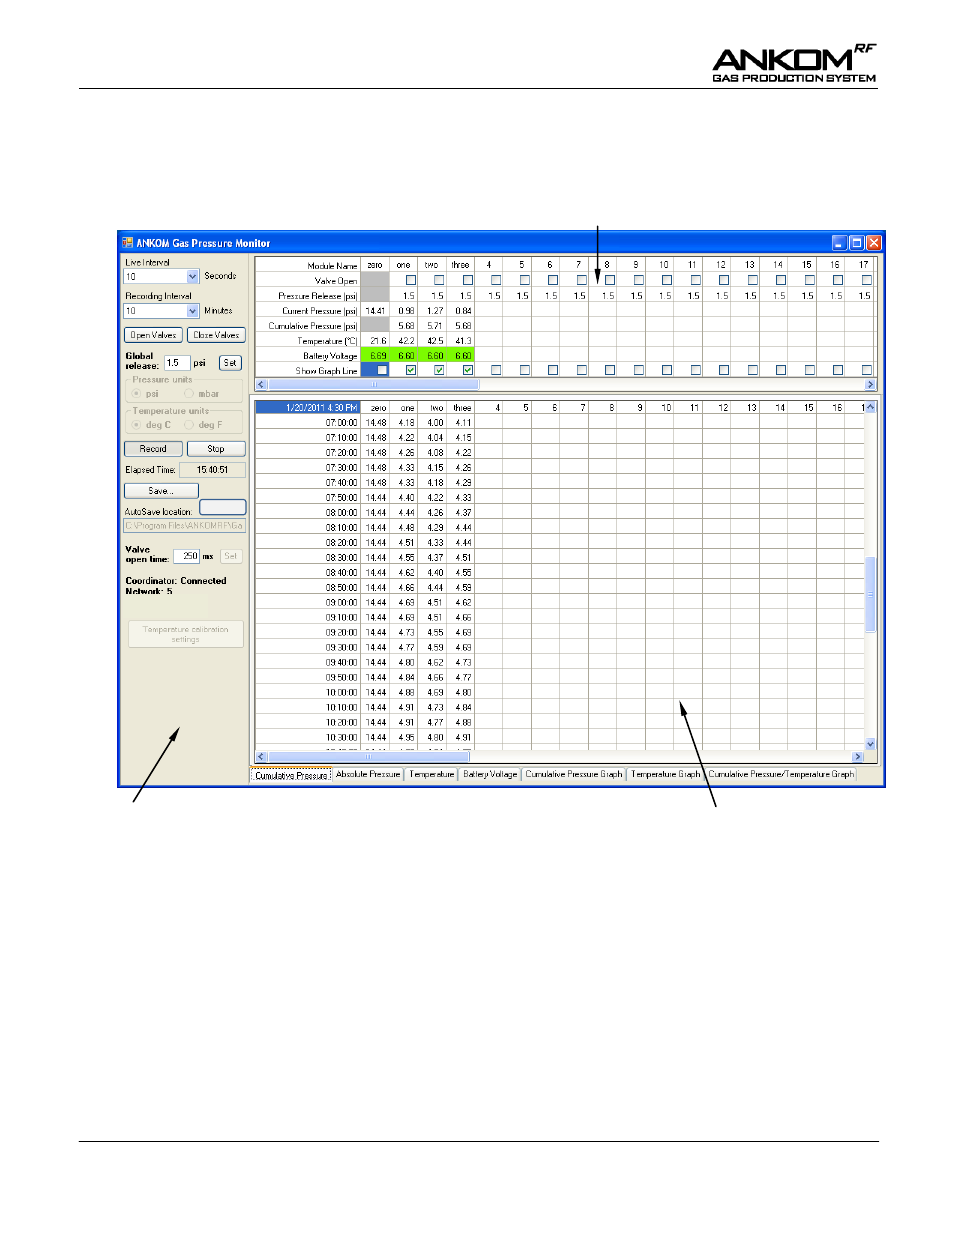
The screen below contains all the controls and data associated with the operation of this system. In this document
we have added some numbers in
RED
to the screen image to identify the functions described below. These
numbers will NOT show on your computer screen.
1
2
3
4
5
6
7
8
9
10
11
12
13
14
15
16 17 18 19 20 21 22
The main screen is divided into 3 sections:
Configuration View
The Configuration View is on the left side of the GPM screen and it displays the
configurable features of the program. Parameters in the Configuration View are saved
when you exit the program.
Live View
The Live View is at the top of the GPM screen and it displays the current status of the
modules. The status will be updated based on the time interval specified in the
Live
Interval box on the Configuration View.
Recording View
The Recording View is in the center part of the GPM screen and it displays the data
recorded during the use of the system (tabs numbered 16 – 19) along with data graphs
(tabs numbered 20 – 22) that are automatically generated to provide the user with a
visual indication of the data being recorded during the gas study. The graphs from tabs
20 – 22 are NOT automatically stored after the study is complete. (See the “Auto
Graphing” section in this manual for further details.)
23
24
25
26
27
28
29
30
Live View
Recording View
Configuration View
Browse
Version: 9.8.3