Operator’s manual – ANKOM RF User Manual
Page 18
Operator’s Manual
pg. 18
Rev F 8/29/14
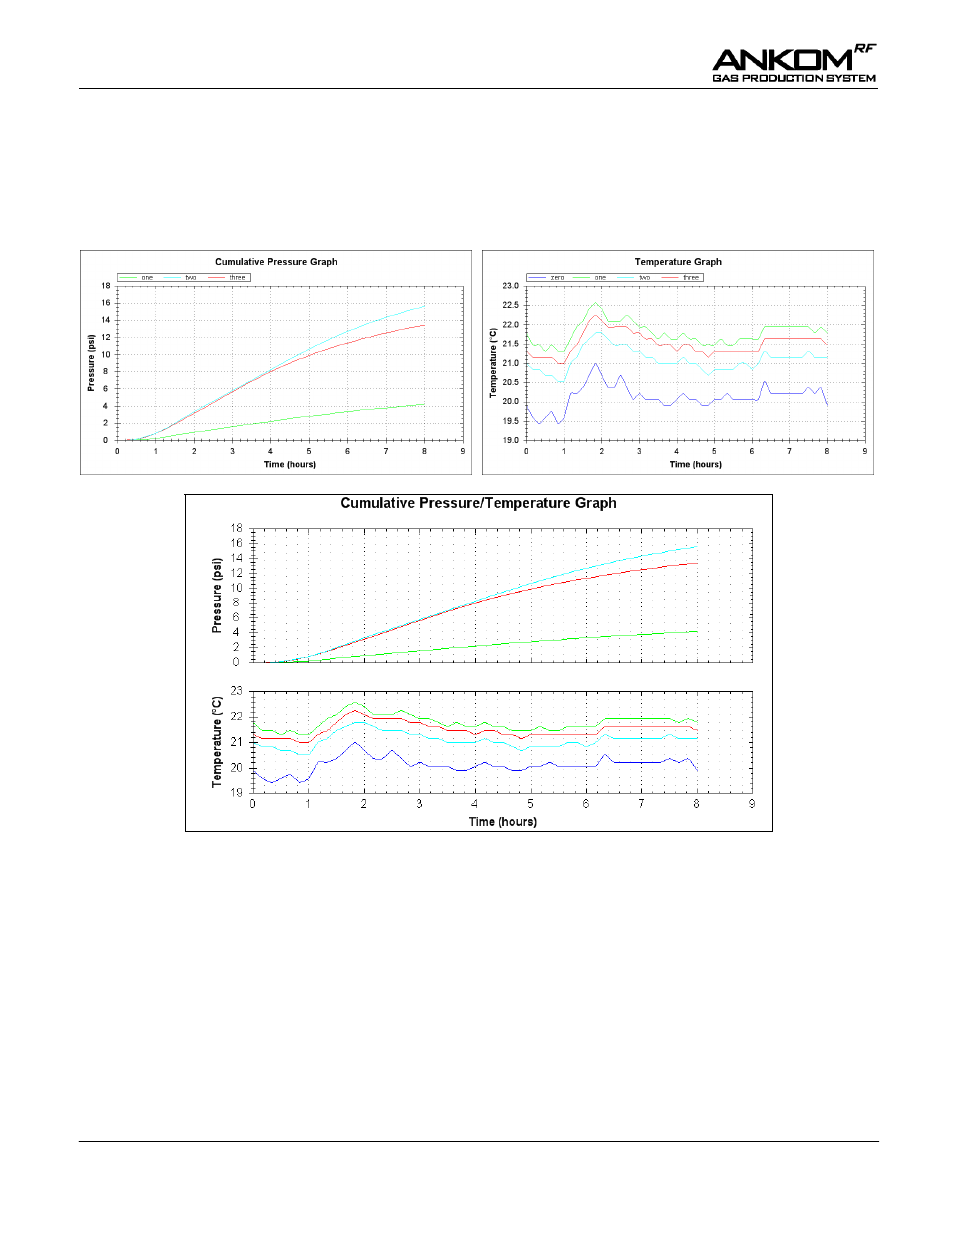
Auto Graphing
In addition to capturing the data points for pressure and temperature, the GPM software has an Auto Graphing
capability that displays line graphs for the cumulative pressure and absolute temperature for each selected Module
within a study. The pressure and temperature graphs can be viewed on separate screens or together on one screen.
Examples of these graphs are shown below.
Sections of each graph can be enlarged by holding down the left button on the computer mouse and dragging the
cursor over the section of interest.
You can also pan to different parts of the graph by holding the center mouse button and dragging the computer
mouse.