Step 4: collect data - a temperature experiment – Vernier CBL Made Easy User Manual
Page 17
CBL Made Easy!
13
Step 4: Collect Data - A Temperature Experiment
Now you are ready for the fun part—collecting data! Here is a simple temperature experiment to try.
4
It
will guide you through the process of making measurements using a temperature probe and the CBL
system. Once you are familiar with the basic steps, you will be able to perform any experiment with the
CBL. It’s that easy!
OBJECTIVES
In this experiment, you will
•
use a TI graphing calculator, a CBL System, and a temperature probe to measure temperature
•
record data
•
make a graph of the data
MATERIALS
CBL System
TI-GRAPH LINK
TI graphing calculator
two 250-ml beakers or two glasses
TI Temperature Probe
cold water (cooled with ice)
CHEMBIO, PHYSICS, or PHYSCI
program hot
water
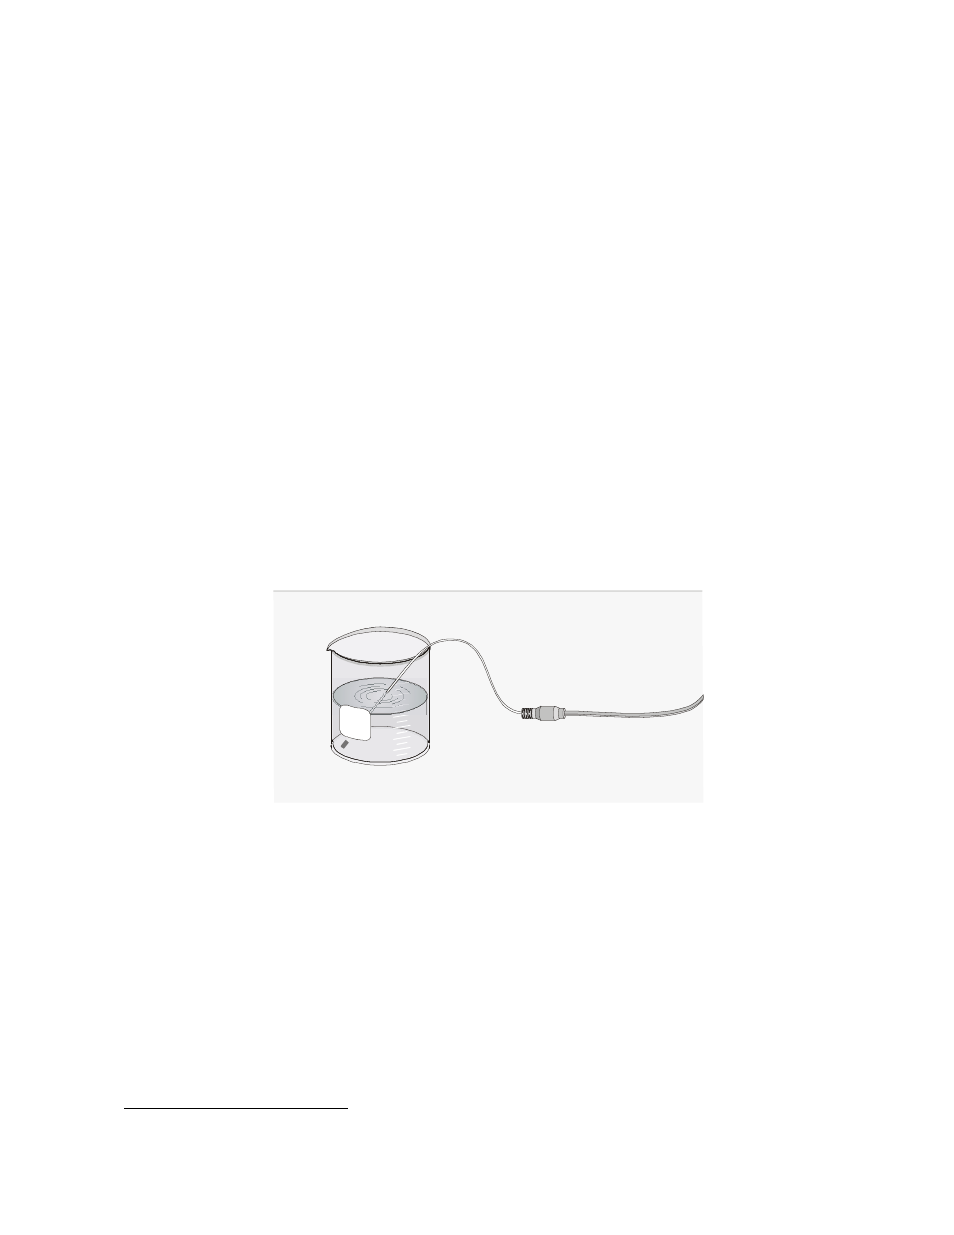
Figure 1
PROCEDURE
1. Place about 100 ml of tap water into a 250-ml beaker or a glass. Add two or three ice cubes.
2. Place a temperature probe into the cold water and stir briefly. Then position the probe in the cold-
water beaker as shown in Figure 1.
3. Plug the temperature probe into Channel 1 of the CBL System. Connect the CBL System to the TI
graphing calculator with the link cable using the port at the bottom of each unit. Firmly press in the
cable ends.
4
This is a modified version of Experiment 1 in Physical Science with CBL, by Don Volz and Sandy Sapatka