Labquest app basics – Vernier Original LabQuest User Manual
Page 7
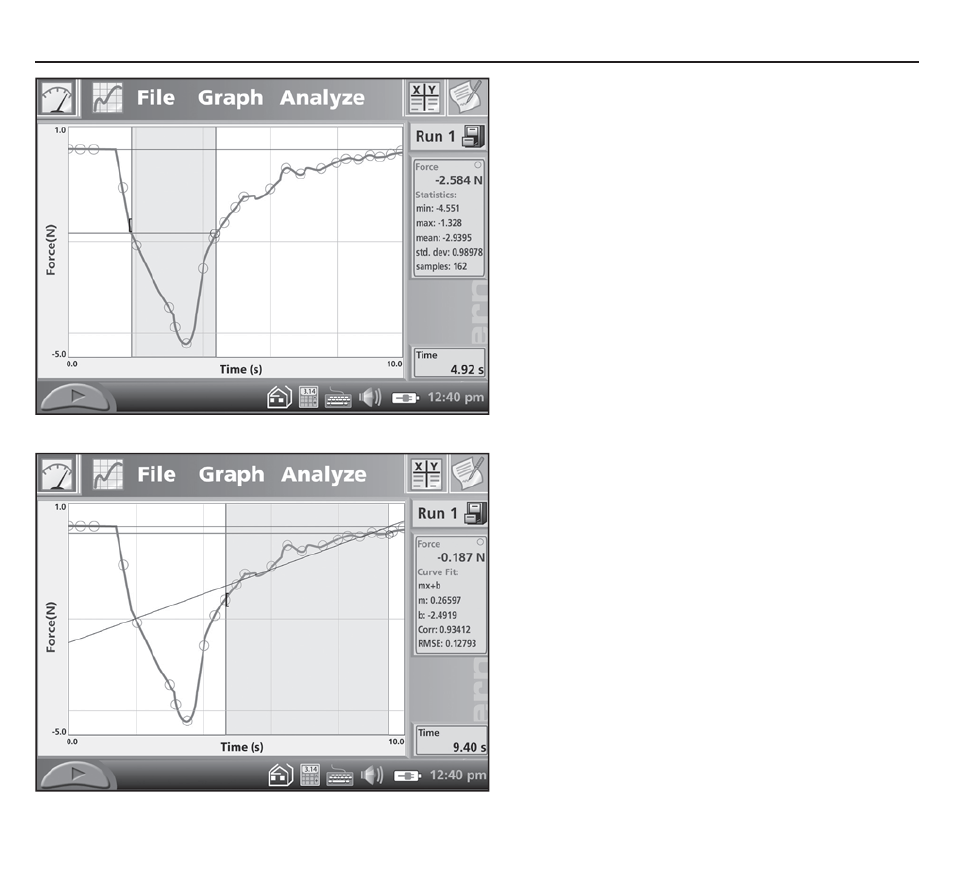
Select a range of data for
statistics or curve fits
Some analysis functions allow you
to select a range of data. To select a
range, use the stylus to drag across
the region of interest. Now you can
perform tasks like integrals, statistics,
or curve fits. Try this: Drag across
a feature on your graph, and then
choose Statistics from the Analyze
menu, choosing the particular sensor
or column, if necessary.
The graph now shows the selected
region, and descriptive statistics are
displayed to the right of the graph.
You can remove the statistics display
by choosing Statistics again from the
Analyze menu.
Curve fits can also start with a
selection. To perform a curve fit, drag
across a region of the graph. Then
choose Curve Fit from the Analyze
menu. In the new screen, you’ll see
your graph, as well as a menu of fit
equations. Display the equations by
tapping the down-arrow to the right
of the list. Tap Linear to perform
a linear fit to your data. The fit
coefficients are shown. To place the
fit on your main graph, tap OK. The
fit and its statistics are shown on the
main screen.
LabQuest App Basics
Statistics on a selection
Curve fit on a selection
LabQuest Quick-Start Guide | 4