Vernier Logger Pro 3 User Manual
Page 13
9
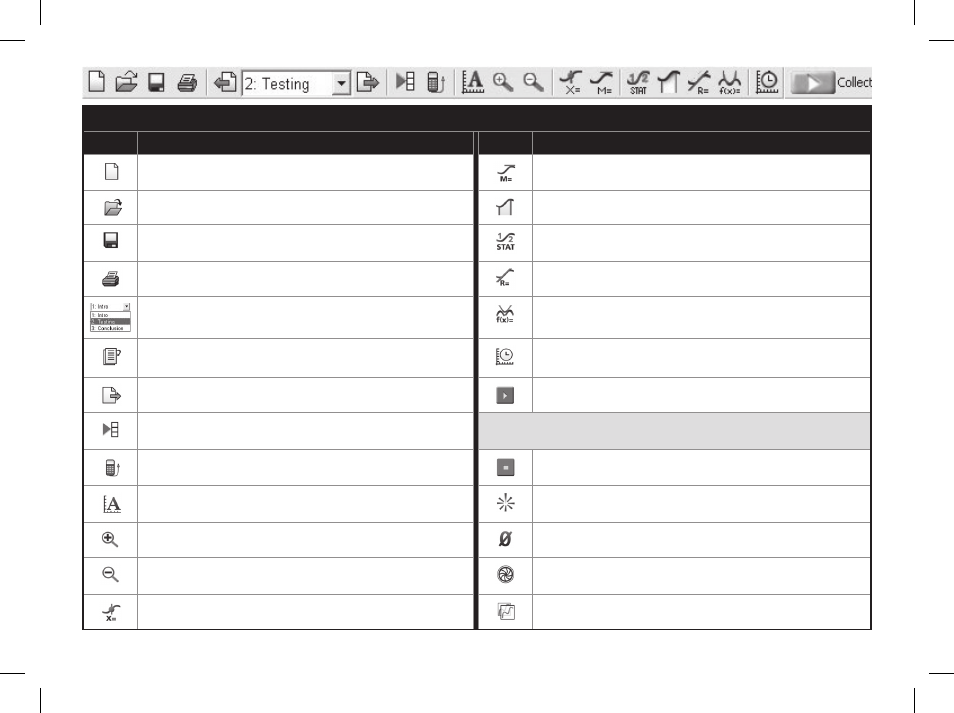
TOOlBaR GuiDe
click
To
click
To
Create a new document.
Enter Tangent Line mode.
Open an existing document.
Integrate selected data range.
Save the active document or template with its
current name.
Calculate statistics on selected data.
Print the screen as displayed on your monitor.
Make a linear fi t to the selected range.
Scroll between pages.
Perform general curve fi ts.
Bring up the previous page of the current
document.
Set data-collection parameters.
Bring up the next page of the current document.
Begin collecting data.
Bring up the Data Browser Window.
(The following icons only appear
when collecting data or if relevant.)
Import data from the Texas Instruments calculator.
Stops collecting data or stops a replay.
Automatically scale the graph to include all
data points.
Tells the heat pulser to generate a pulse.
Zoom in to the selected region of the graph.
Click this button to keep a data point.
Zoom out by a factor of two in both x- and
y-directions.
Click the Zero button to set the current value of
a sensor to zero.
Enter Examine mode.
Create a new Graph Match.