Rane THX Room EQ User Manual
Page 17
Home THX Equalization Manual Rev. 1.5
17
NOTE: CHECK THE OVERALL SPLs AT EACH MICROPHONE LOCATION. IF THESE VARY BY
MORE THAN ± 1 dB, ADJUST THE MASTER VOLUME ON THE CONTROLLER TO COMPENSATE
THE SPL AT EACH LOCATION TO APPROXIMATE THE SPL AT THE REFERENCE POSITION
(Microphone 1). FAILURE TO DO SO MAY RESULT IN SKEWED SPATIAL AVERAGES.
With the four positions stored in memory, now average to obtain the spatial response for the
entire listening area. Notice that we have used the method of obtaining several samples for each
microphone position to smooth out the stochastic effects of the pink noise.
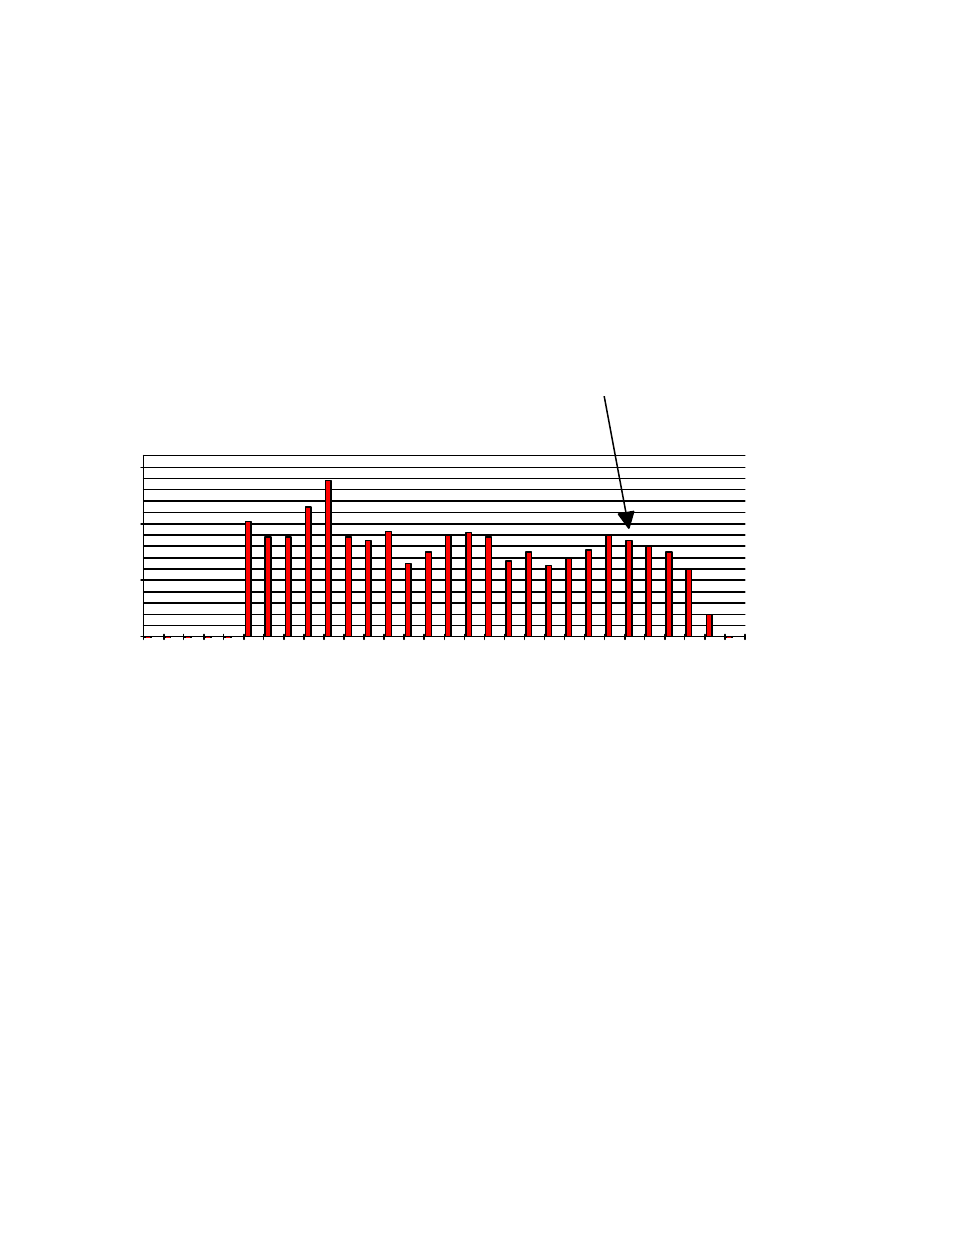
NOTE: DISPERSION AND AIR ABSORPTION AT HIGHER FREQUENCIES WILL CAUSE A
GENTLE ROLL OFF IN RESPONSE BEGINNING AROUND
6 kHz. THIS IS NORMAL AND DOES
NOT REQUIRE EQUALIZATION. (Fig. 10)
Typical Unequalized LCR Room Response
Frequency Hz
dB
SPL
60
65
70
75
25
40
63
100
160
250
400
630
1000
1600
2500
4000
6300
10000
16000
Fig 10
2.5) Equalize:
The resulting spatial average will approximate the inverse of the correct EQ curve. As a starting
point, assume that a dip of -3 dB on the analyzer calls for an increase at the appropriate EQ frequency
of +3 dB. Since we will re measure a number of times, any over correction or under correction will be
caught. When analyzing the averaged RTA curve try to look for the mean SPL for all frequencies and
adjust the peaks and dips to that mean.
Remember that we are trying to achieve a response in the LCR channels of ± 1 to 2 dB, from 100
Hz to 1 kHZ, without drastic EQ shifts. A boost of 6 dB places many demands on both amplifiers and
loudspeakers.