Rane THX Room EQ User Manual
Page 11
Home THX Equalization Manual Rev. 1.5
11
You will have achieved a correct EQ curve when successive measurements show the same flat re-
sponse.
Repeat this procedure for each remaining screen channel and the subwoofer. Use the appropri-
ate track on “Wow!” or your pink noise source, and remember to connect only the speaker that you are
testing. Your front channels are now equalized.
1.7) Compare EQ Settings
NOTE: IN INSTALLATIONS THAT ALLOW FOR SYMMETRICAL L/R SPEAKER ROOM PLACE-
MENT, CONFIRM THAT THE EQ SETTINGS FOR L & R CHANNELS ARE SIMILAR. Small varia-
tions of 1 dB in individual 1/3 octave bands are tolerable. In asymmetrical L/R speaker placement,
larger variations in EQ curves are acceptable; particularly at the lower frequencies where boundary
effects are most common.
Using R-2, the comparison function compares the curve in memory to a curve on the disk drive.
This means that the stored curve on the disk drive is always assumed to be the reference. The result-
ing difference curve shows the deviation of the curve in memory from the reference curve. To com-
pare a curve on display to a stored curve, select
F-2
, then select the reference curve from the
items listed. You can save the resulting comparison by hitting
F-9
.
1.8) Equalizing the Subwoofer
Measuring the Subwoofer is very similar to measuring the LCR channels with one exception.
Because the pink noise source will exhibit larger instantaneous fluctuations in amplitude at lower
frequencies (see the section on pink noise in the introduction), longer averaging times may be neces-
sary to improve measurement consistency. If you are using “Wow!” as the pink noise source, use the
Center Channel Pink Noise (Chapter 9). Otherwise connect your pink noise source into the both Left
and Right channel inputs of your decoder.
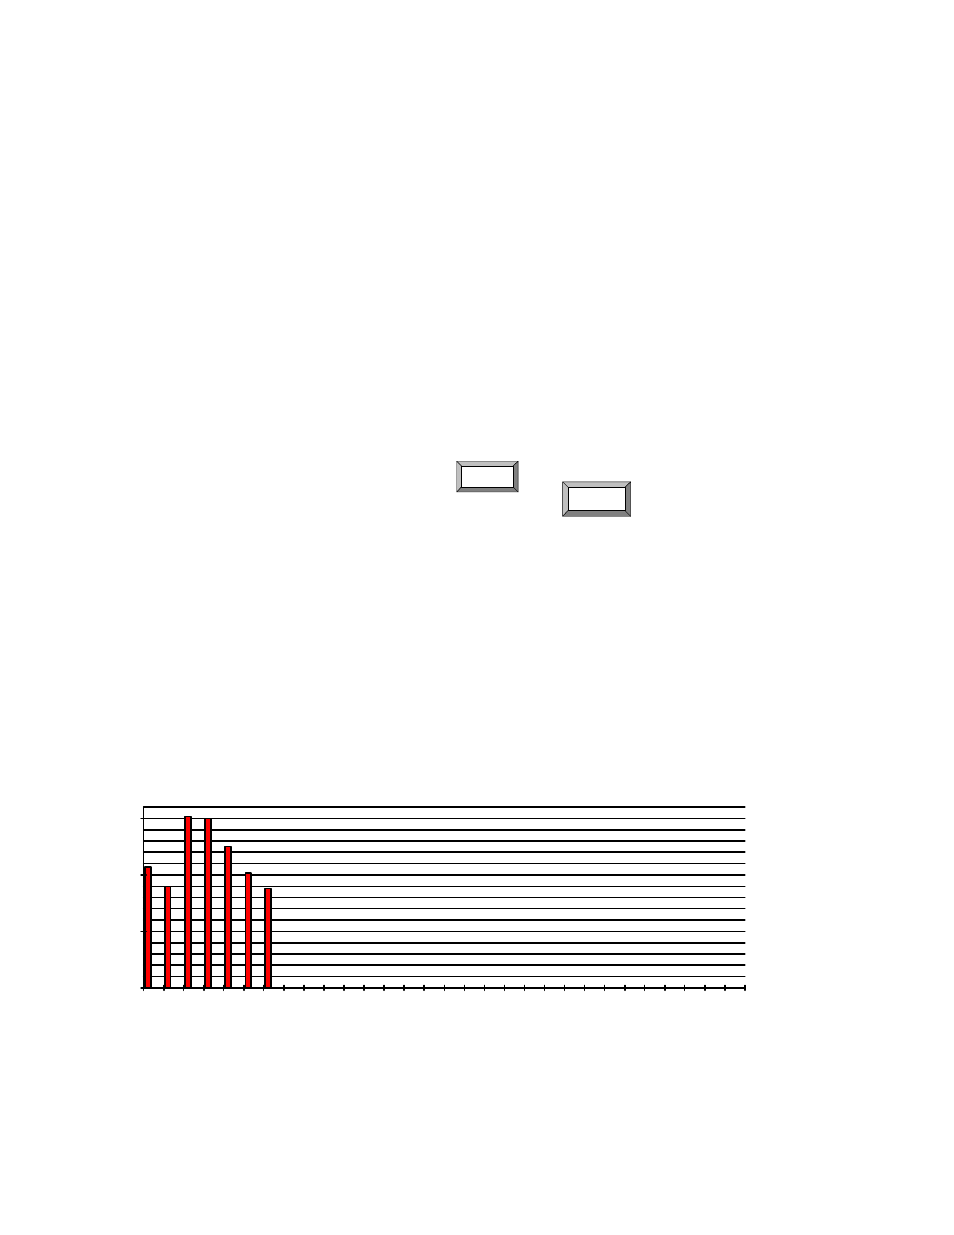
Unequalized Subwoofer Room Response
Frequency Hz
dB
SPL
60
65
70
75
25
40
63
100
160
250
400
630
1000
1600
2500
4000
6300
10000
16000
Fig 5