Figure 10, Vs. 12, Generation cluster – idle power comparison – Dell PowerEdge 1655MC User Manual
Page 25: Figure 11, Generation vs 12, Generation - idle power, Generation - performance and energy efficiency
Optimal BIOS settings for HPC with Dell PowerEdge 12
th
generation servers
25
Figure 10. 11
th
vs. 12
th
generation cluster – idle power comparison
* Logical Processor and Node Interleaving Disabled. All other options at defaults.
Figure 11. 11
th
vs. 12
th
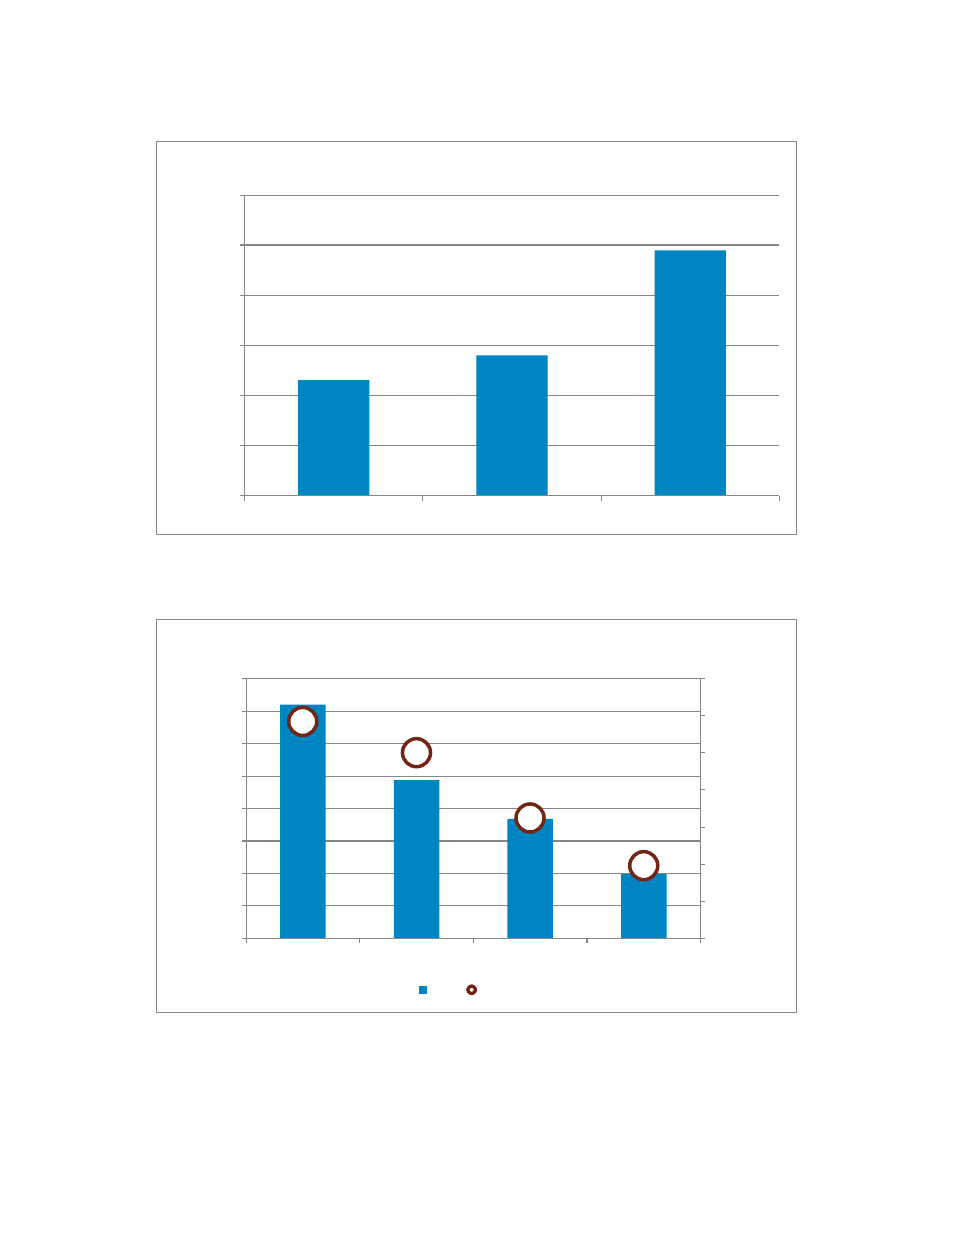
generation cluster – performance and energy efficiency comparison
* Logical Processor and Node Interleaving Disabled. DAPC System Profile. All other options at defaults.
Figure 11 compares the performance and energy efficiency of different applications on the two
clusters. For each test, the cluster is fully subscribed, i.e., all cores are in use. The height of the bar
0%
5%
10%
15%
20%
25%
30%
DAPC
OSCtl
Perf
Idle
power
sav
ing
with
12
th
Ge
ne
rati
o
n
11
th
Generation vs 12
th
Generation - Idle power
2.92
2.50
1.62
0.98
0.00
0.50
1.00
1.50
2.00
2.50
3.00
3.50
0.00
0.50
1.00
1.50
2.00
2.50
3.00
3.50
4.00
HPL
Fluent
truck_poly_14m
WRF
conus_12k
LU
class D
Ener
gy
eff
ic
ienc
y
of
12
th
Gener
at
ion
rel
at
ive
to
11
th
Gener
at
ion
Per
fo
rmance
of
1
2
th
Gener
at
ion
rel
at
ive
to
11
th
Gener
at
ion
11
th
Generation vs 12
th
Generation - Performance and
Energy efficiency
Perf
Perf/Watt