Svw f – Casio CFX-9970G User Manual
Page 5
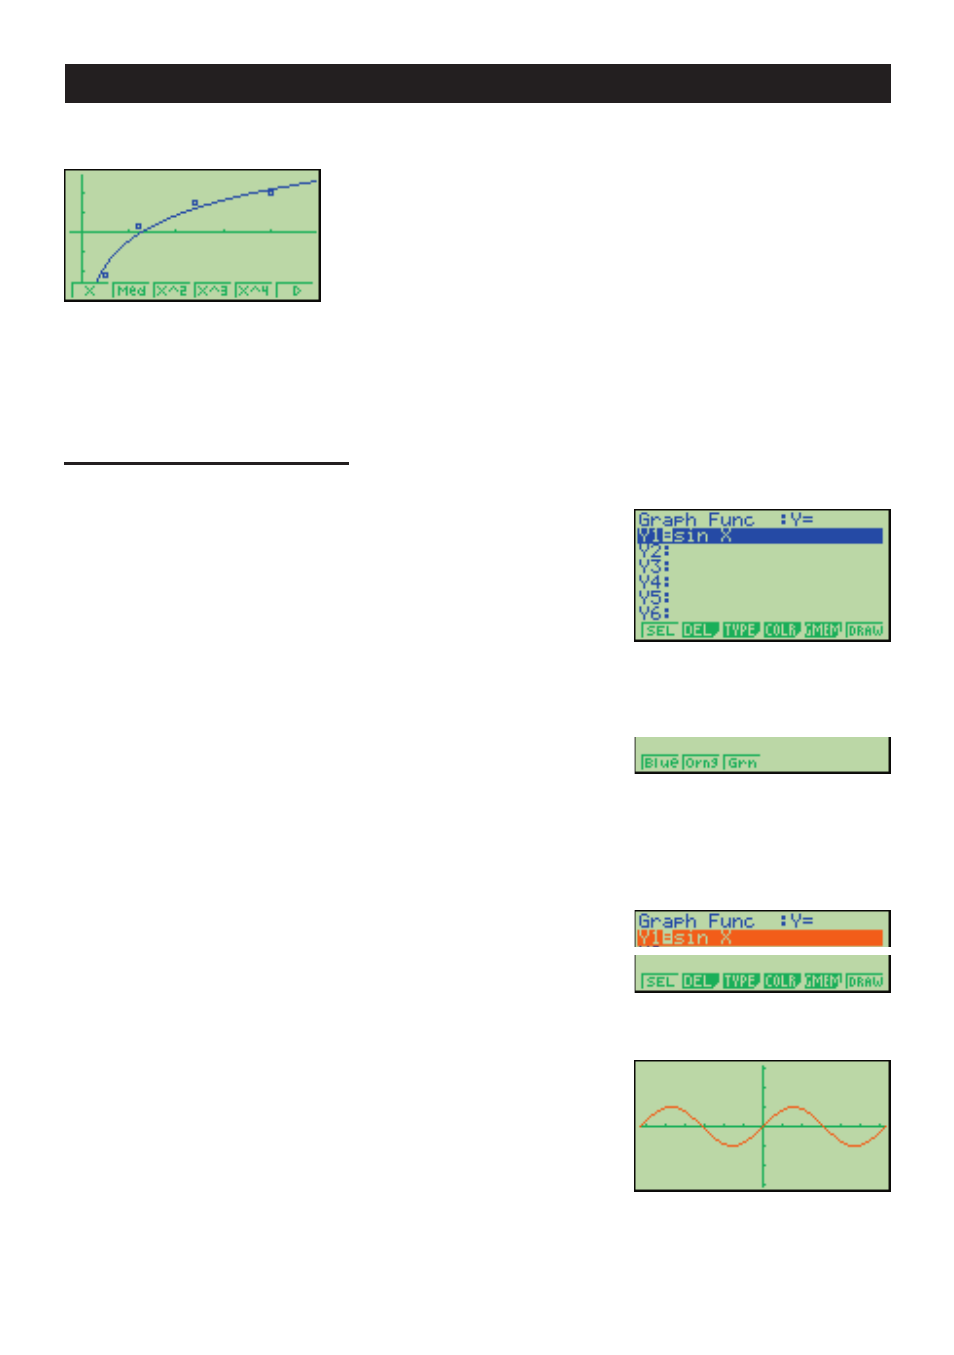
• Statistical Regression Graph Example
• When you draw a graph or run a program, any comment text normally appears on the
display in blue. You can, however, change the color of comment text to orange or green.
Example: To draw a sine curve
1. Enter the GRAPH Mode and input the following.
3
(TYPE)
1
(Y=)
(Specifies rectangular coordinates.)
svw
f
4
5
(Stores the expression.)
2.
4
(COLR)
2
3456
• Press the function key that corresponds to the color you want to use for the graph:
1
for blue,
2
for orange,
3
for green.
3.
2
(Orng)
(Specifies the graph color.)
J
6
4.
6
(DRAW)
(Draws the graph)
You can also draw multiple graphs of different color on the same screen, making each one
distinct and easy to view.
iv
This manual is related to the following products:
- CFX-9850G PLUS Getting Acquainted CFX-9850GB PLUS Getting Acquainted CFX-9850GC PLUS Getting Acquainted CFX-9950GB PLUS Getting Acquainted fx-9750G PLUS Getting Acquainted fx-9750G PLUS CFX-9850G PLUS CFX-9850GB PLUS CFX-9850GC PLUS CFX-9950GB PLUS CFX-9970G Numerical Calculations CFX-9970G Basic Operation CFX-9970G Complex Numbers CFX-9970G Equation Calculations CFX-9970G Graph Solve CFX-9970G Matrix Calculations CFX-9970G Sketch Function CFX-9970G Graph-to-Table CFX-9970G Graphing CFX-9970G Dual Graph CFX-9850GB CFX-9970G Implicit Function Graphs CFX-9970G Dynamic Graph CFX-9970G Table & Graph CFX-9970G Recursion Table and Graph CFX-9970G List Function CFX-9970G Financial Calculations CFX-9970G Data Communications CFX-9970G Program Library CFX-9970G Programming CFX-9970G Statistical Graphs and Calculations