Precipitation, Sea surface temperature (sst), Wave indication – B&G Zeus2 12 User Manual
Page 92: Weather icons
Key
Description
1
Precipitation color shading
2
City forecast icon
3
Wind barb
4
Storm icon
5
SST color bar
6
SST color shading
Use the Sirius weather option menu to select which weather symbology that should be
displayed and how they should appear on the chart panel.
Precipitation
Shades of color are used to show precipitation type and intensity. Darkest color indicates
highest intensity.
Precipitation type
Color code
Rain
From light green (light rain) - yellow - orange
- to dark red (heavy rain)
Snow
Blue
Mixed
Pink
Sea Surface Temperature (SST)
Can be shown as color shading or text.
When color coding is selected, the SST color bar will be shown on the left side of the display.
You can define which temperature range that shall be color coded as described later in this
section.
Wave indication
Colors are used to indicate forecasted wave height. Dark red indicate the highest waves,
while blue are used for the lowest.
You can define which height range shall be color coded as described later in this section.
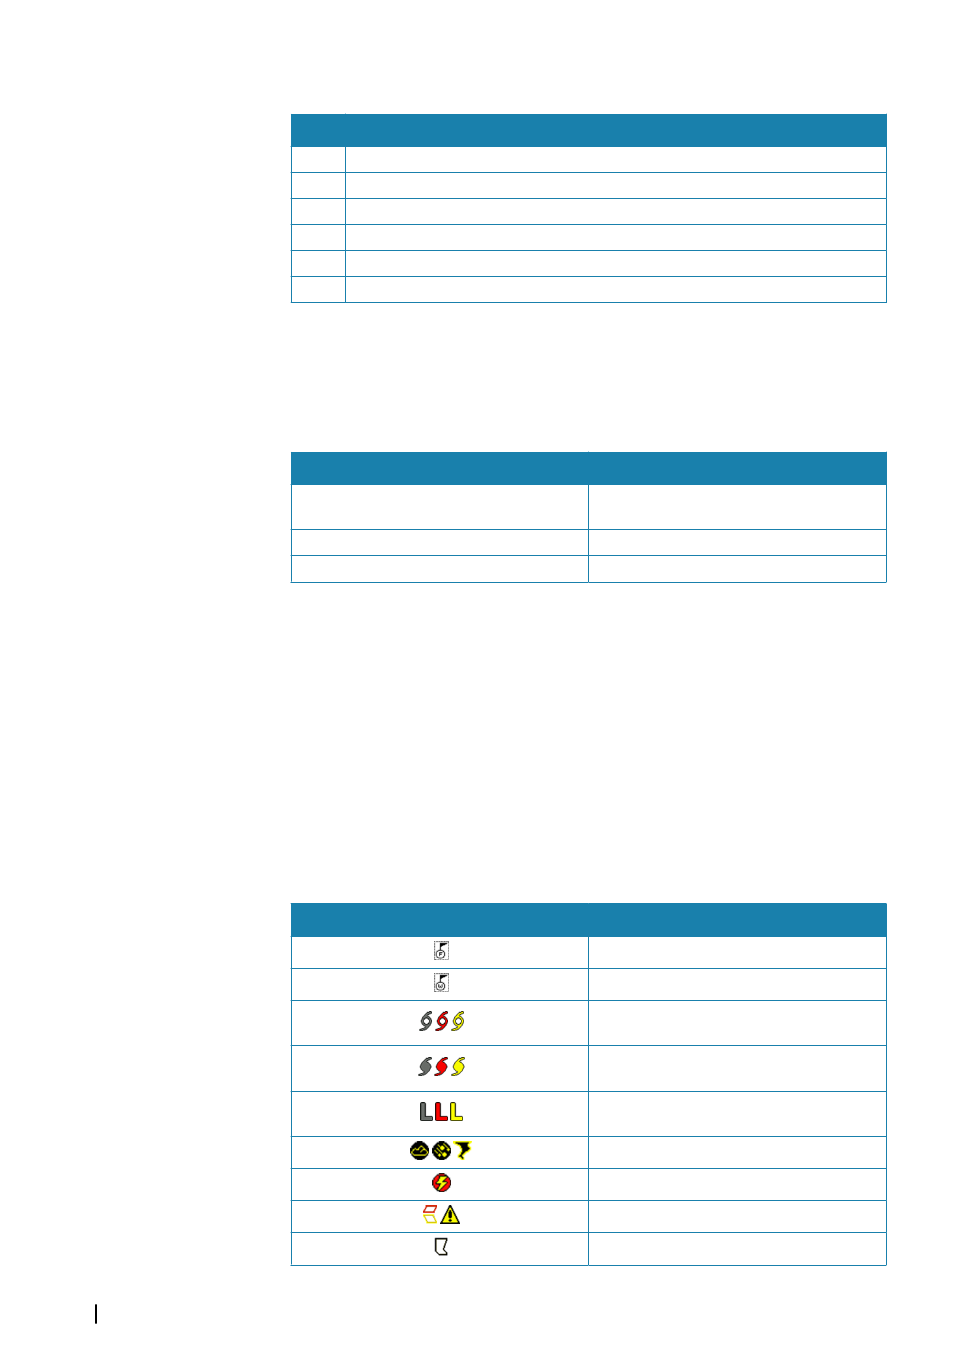
Weather icons
Several weather icons are available to show current or predicted weather conditions. You can
select an icon to display detailed weather information.
Icon
Description
City forecast
Surface observation
Tropical storm tracking; past (grey) - present
(red) - future (yellow)
Hurricane (category 1-5) tracking; past (grey)
- present (red) - future (yellow)
Tropical disturbance/depression tracking;
past (grey) - present (red) - future (yellow)
Storm attributes
Lightning
Watch box location and warning
Marine zone location
92
Weather
| Zeus2 Operator Manual