HF scientific Micro200BW Turbidimeter - 0 -1000 NTU User Manual
Page 26
Page 12
MICRO 200 BW 0 - 1000 NTU (5/05)
Rev. 3.1
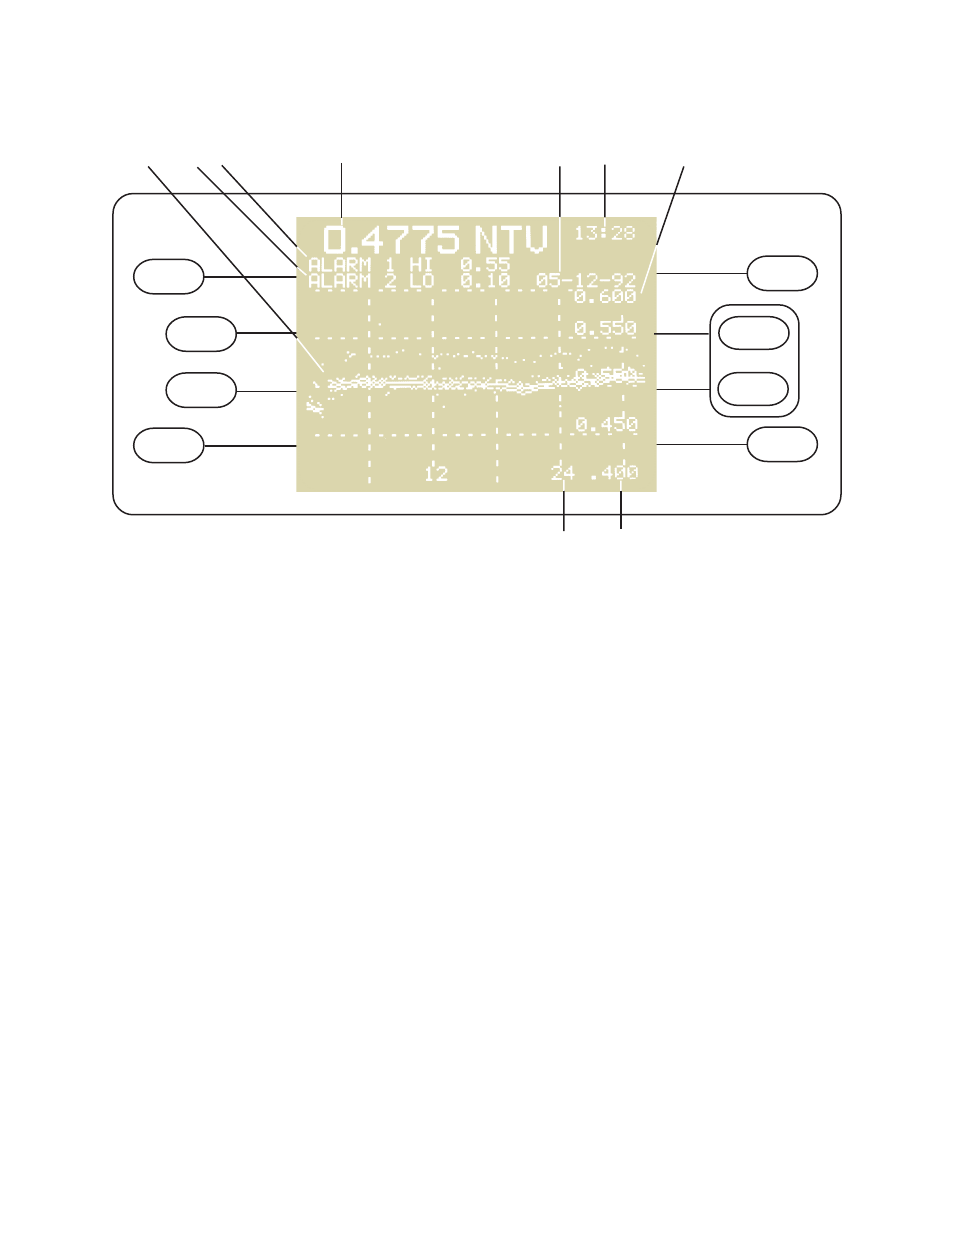
2. Turbidity Display
This is the turbidity display. The display shown above is fairly typical. The display has the following parameters:
1 -
CURRENT TURBIDITY READING: 477.5 NTU
2 -
GRAPH TIME BASE: 24 HOURS
3 -
GRAPH UPPER LIMIT: 600 NTU
4 -
GRAPH LOWER LIMIT: 400 NTU
5 -
ALARM 1 SETTING: ALARM ON HIGHER THAN 550 NTU
6 -
ALARM 2 SETTING: ALARM ON LOWER THAN 100 NTU
7 -
TIME: 1:28 PM (SHOWN IN 24 HOUR CLOCK MODE)
8 -
DATE: MAY 12 1992
9 -
GRAPH OF TURBIDITY HISTORY (High, Ave. & Low)
To leave the turbidity display and get to the Main Menu push MENU. F1 - F5 are nonfunctional in this display. Please note
that the graph history shows the highest readings, the lowest readings and the average readings taken within the sample period.
F2
F3
ALARM
F5
F4
MENU
F1
1
6
7
9
2
4
5
3
8