View dose graph – RaySafe i2 Dose Viewer User Manual
Page 15
15
RaySafe i2 dose viewer user manual – Using dose viewer
internal clock will be synchronized to the same time as the host PC, including the Windows
time zone settings. If you are using multiple dosimeters, it is important to synchronize time for
the dosimeters with the same PC, because they will have the same time reference.
NOTE
If you need to change the time backwards to where there is dose history stored, the dose
history will have to be reset and all dose history will disappear. This is done automatically; you
just need to confirm the action.
NOTE
The synchronization takes immediate effect and you do not need to press the save button.
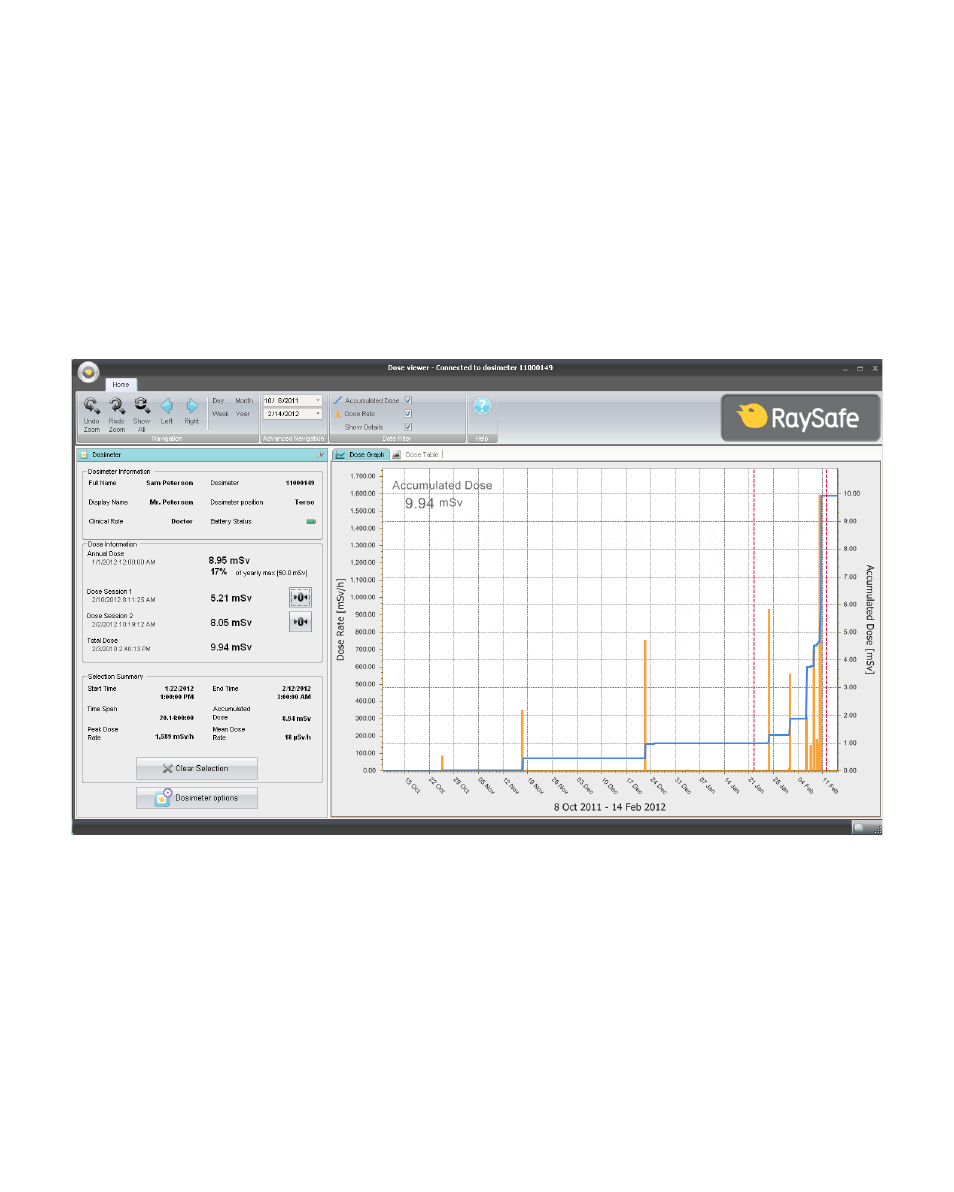
vIew doSe gRAPH
Figure 7. Dose graph with selection (vertical red dotted lines)
Use the data filter panel in the home menu tool bar to select which information to be visible in the graph:
• Accumulated dose graph, right axis – blue graph
• dose rate graph, left axis – orange graph, displays dose rate samples for every second, where such data is
available