Interpreting flow data – Elkhart Brass Sidewinder 8494 Monitor User Manual
Page 19
15
40
50
75
100
125
150
175
200
SS
N. FOG
W. FOG
SS
N. FOG W. FOG
SS
N. FOG W. FOG
SS
N. FOG
W. FOG
40
88
47
32
91
51
34
91
53
35
97
57
39
50
98
51
34
101
54
36
102
56
40
108
61
43
75
114
59
36
117
61
40
118
62
43
126
67
47
100
126
69
39
132
73
44
136
75
48
142
70
52
125
141
76
44
148
78
48
152
79
51
160
86
55
150
152
81
48
159
83
52
164
83
54
173
89
59
175
165
88
51
-
-
-
179
89
58
188
95
63
200
178
95
54
-
-
-
193
95
62
203
102
67
175 GPM Stem
200 GPM Stem
250 GPM Stem
350 GPM Stem
111
126
172
220
124
141
192
240
150
173
230
289
175
200
250
325
192
224
279
362
210
245
306
398
231
265
331
429
175 GPM Stem
200 GPM Stem
250 GPM Stem
350 GPM Stem
5000-24 Reach Data (ft)
5000-24 Flow Data (GPM)
247
283
353
459
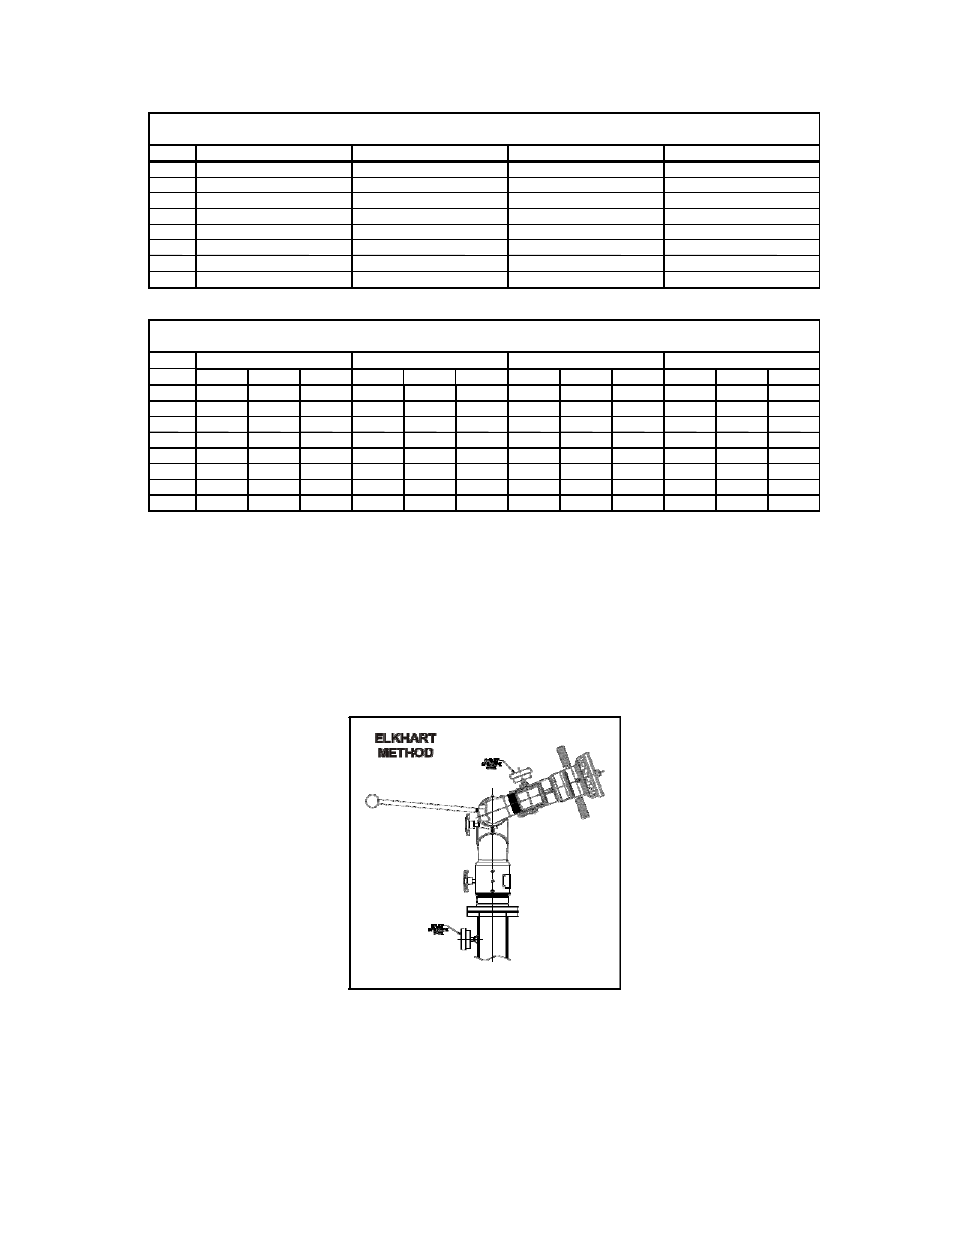
Figure 17
5000-24 Flow and Reach Data
Interpreting Flow Data
The following graphs offer the pressure losses for the monitor (and other devices) in terms of
Total Static Pressure Drop. This Total Static Pressure Drop can be found by measuring the
difference between the static inlet pressure and the static outlet pressure. The static
pressure at either of these points can be found using a simple pressure gauge. An
illustration of this method can be seen below.
In mathematical terms, the Total Static Pressure Drop is the change in Velocity Pressure
plus Friction Loss. The change in Velocity Pressure results from the change in velocity of
water caused by the change in the cross section of a waterway. Friction Loss results from
the drag and sidewall interference of the water through a device. A simple equation can be
seen below.