J.P. Instruments EDM 900 Pilots Guide User Manual
Page 20
Page 20
Engine Data Management
Linear Bar Graph Displays
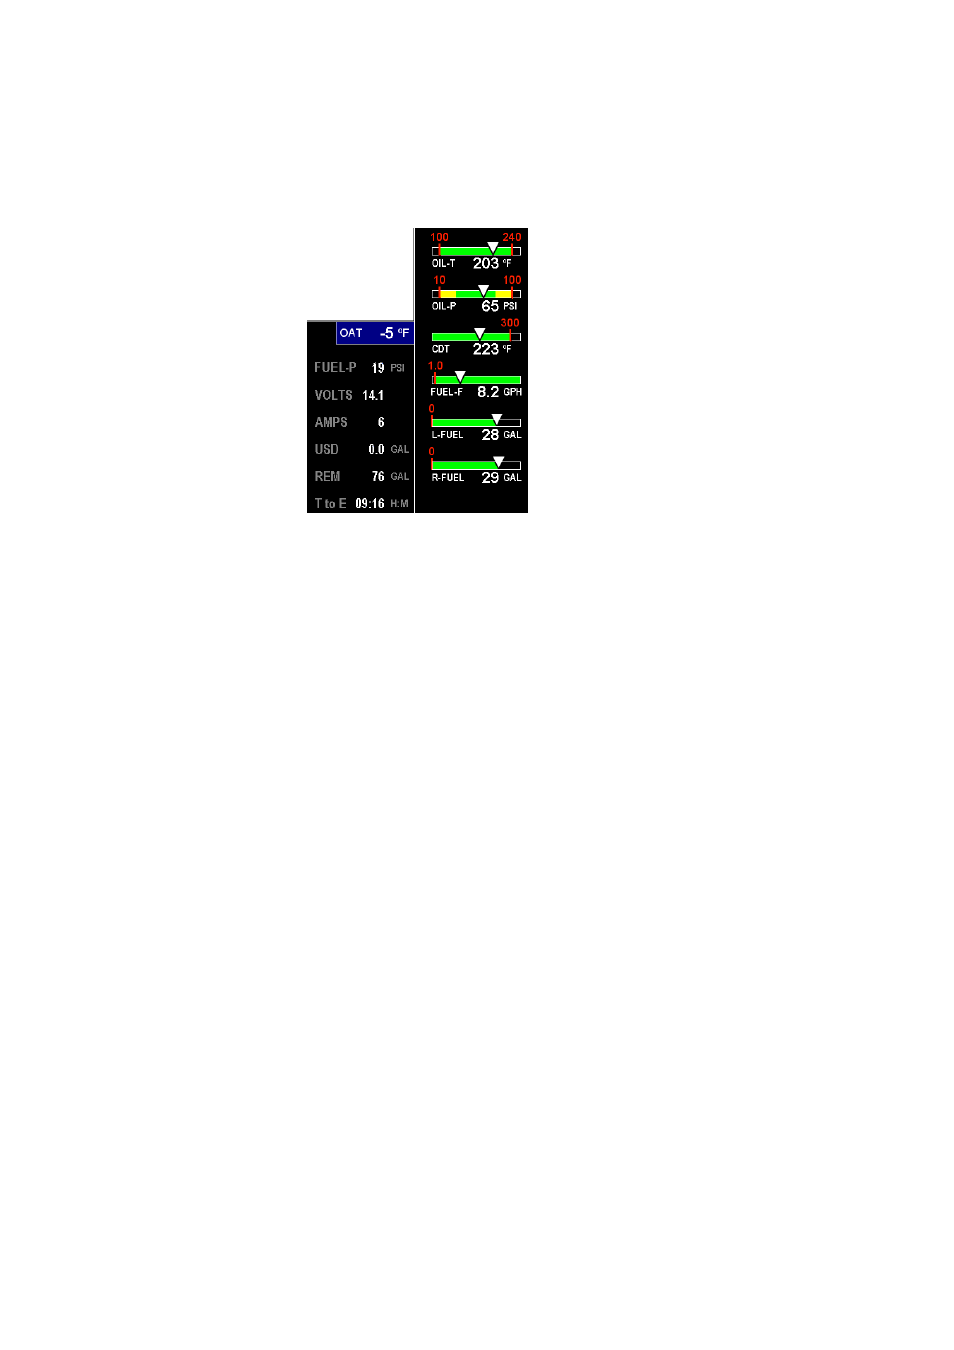
The linear bar graphs are
arranged on the right half of the
display. A typical layout is
depicted here (Note: your actual
configuration may vary). Typical
functions that can be displayed
are:
Primary gauges
Oil temperature
Oil pressure
Compressor Discharge
temp
Fuel Flow.
Left tank fuel quantity
Right tank fuel quantity
Non Primary gauges
Fuel pressure
Volts
Amps
Fuel USED Estimated
Fuel REM Estimated
Time to Empty Estimated
Outside Air Tem.
The range of the bar graphs depends on the programming. Range,
redlines and/or limits are typically set to match the original aircrafts gauge
markings. These are locked for Primary installations, however non-
primary gauges can be user modified.
Non Primary
Primary