Table 1.9: sensor graph parameters, Figure 1.2 sh, Figure 1.2 has a – Avocent 5240 User Manual
Page 23
Chapter 1: Introduction 11
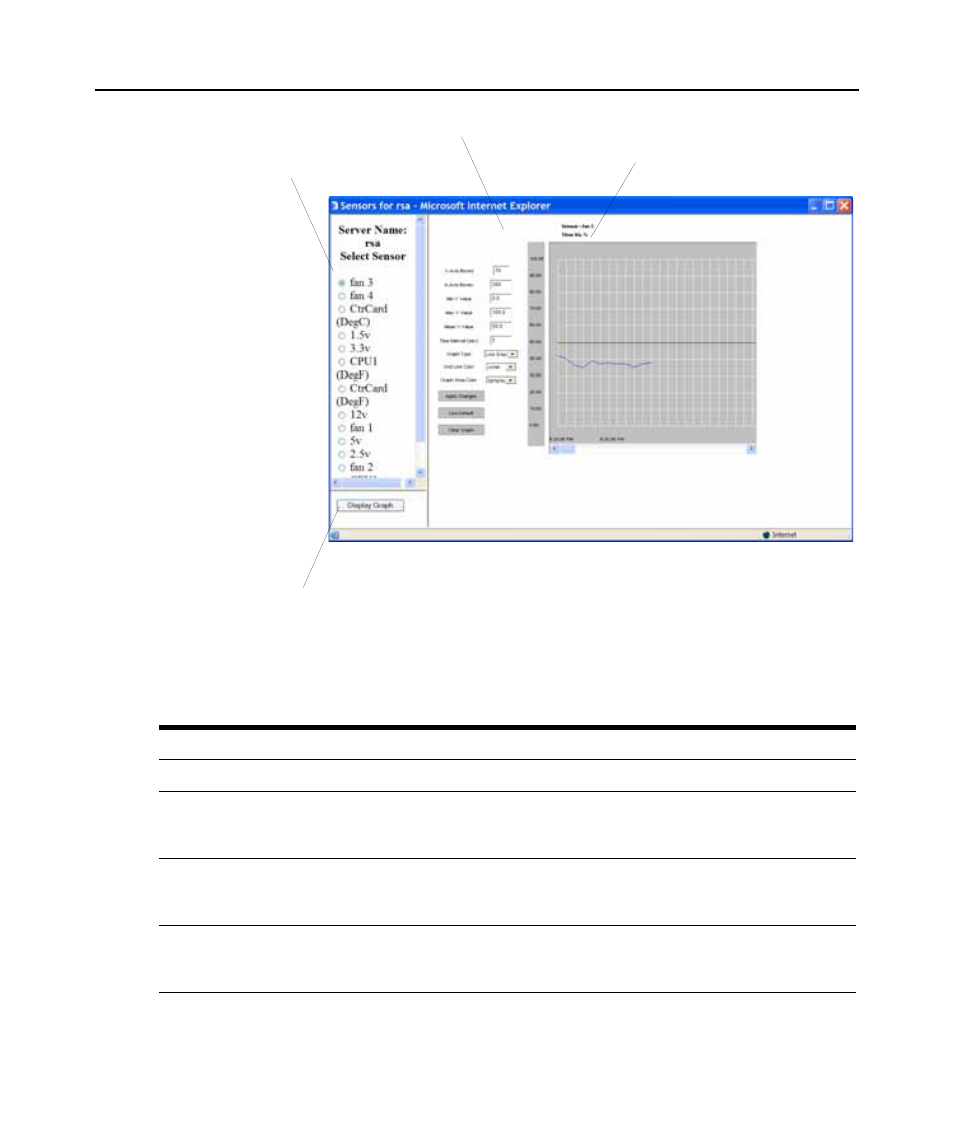
Figure 1.2: Example Graph for Readings From a Fan Sensor
Table 1.9 shows graph features that can be modified. An error message appears if you enter a value
that is greater than or lower than the supported range of values.
Table 1.9: Sensor Graph Parameters
Field/Menu
Use
Default
Allowed Values
y-Axis Boxes
Specify a different number of rows.
10
1-55
x-Axis Boxes
Specify a different number of columns.
Each graph cell represents the interval
between readings.
300
1-999
Min Y Value
Specify a different minimum sensor value to be plotted
on the x axis. The only valid keys are numeric keys,
period (.) and hyphen (-).
Varies with the
type of sensor
Varies with the
type of sensor
Max Y Value
Specify a different maximum sensor value to be
plotted on the y axis. The only valid keys are numeric
keys, period (.) and hyphen (-).
Varies with the
type of sensor
Varies with the
type of sensor
Sensors List
Graph Area
Display Graph Button
Graph Heading