Cs5571 – Cirrus Logic CS5571 User Manual
Page 23
CS5571
DS768PP1
23
3/25/08
10:56
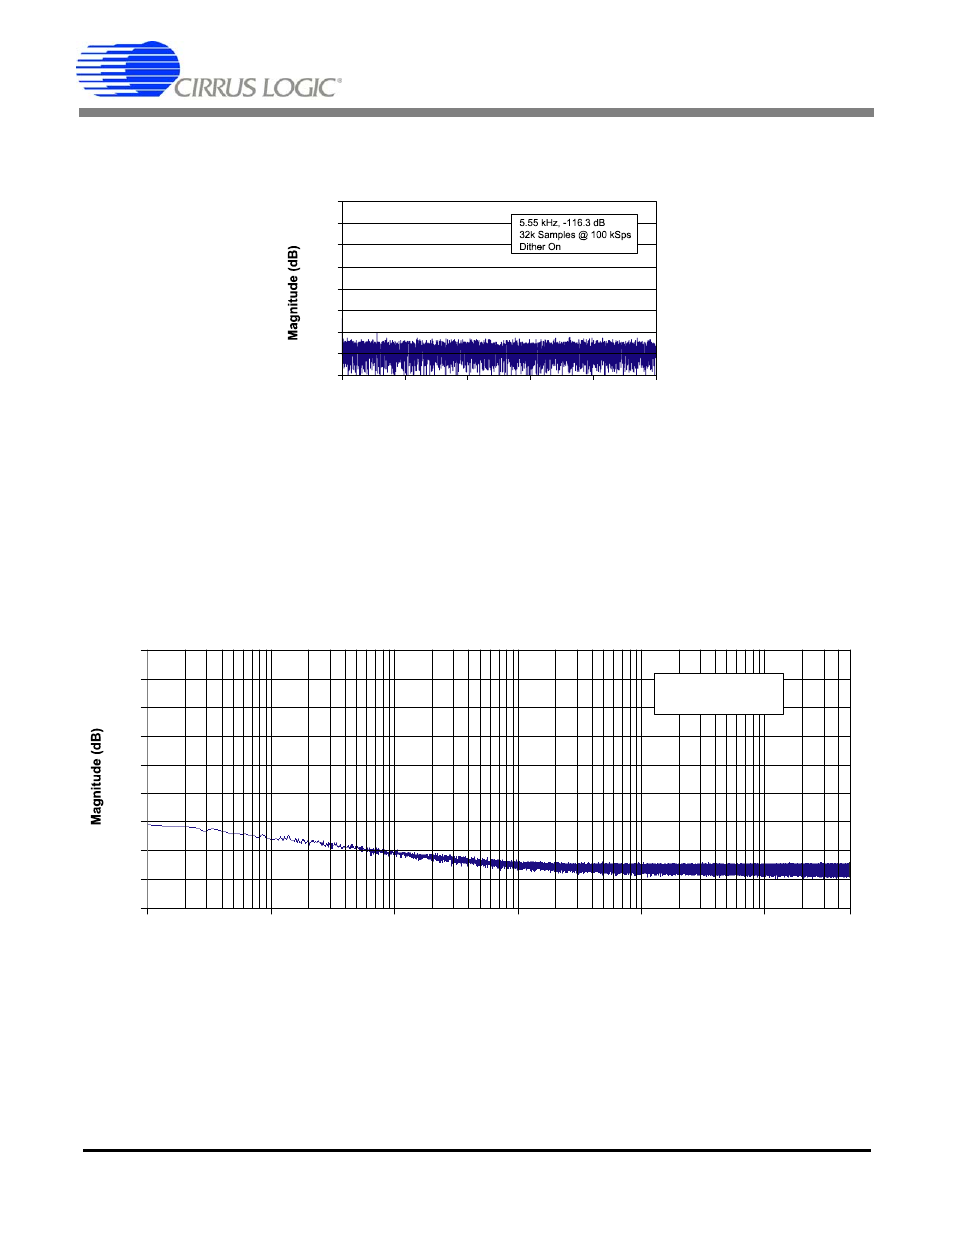
Figure 18 illustrates a test signal of 5.55 kHz, 116.3 dB down, which is only 6.3 microvolts peak to peak,
or about 1/10 of a code width. The converter can reliably digitize this signal because of its excellent DNL
and proper dither.
Figure 19 is a spectral plot of the converter with its input grounded. The spectral information is on a log-
arithmic frequency axis as this illustrates the very low frequency behavior of the converter. Figure 19 was
produced from averaging the results of 16 FFT outputs using 2 million samples each. This plot also illus-
trates that the converter noise floor is free of spurious components that may be present in other converters
due to on-chip digital interference.
-160
-140
-120
-100
-80
-60
-40
-20
0
0
10k
20k
30k
40k
50k
Frequency (Hz)
Figure 18. Spectral Performance, -116.3 dB
Dither On
-140
-120
-100
-80
0.1
1
10
100
1k
10k
-160
-180
-60
-40
-20
0
50k
Frequency (Hz)
Shorted Input
2M Samples @ 100 kSps
16 Averages
Figure 19. Spectral Plot of Noise with Shorted Input