An299 – Cirrus Logic AN299 User Manual
Page 7
AN299REV1
7
AN299
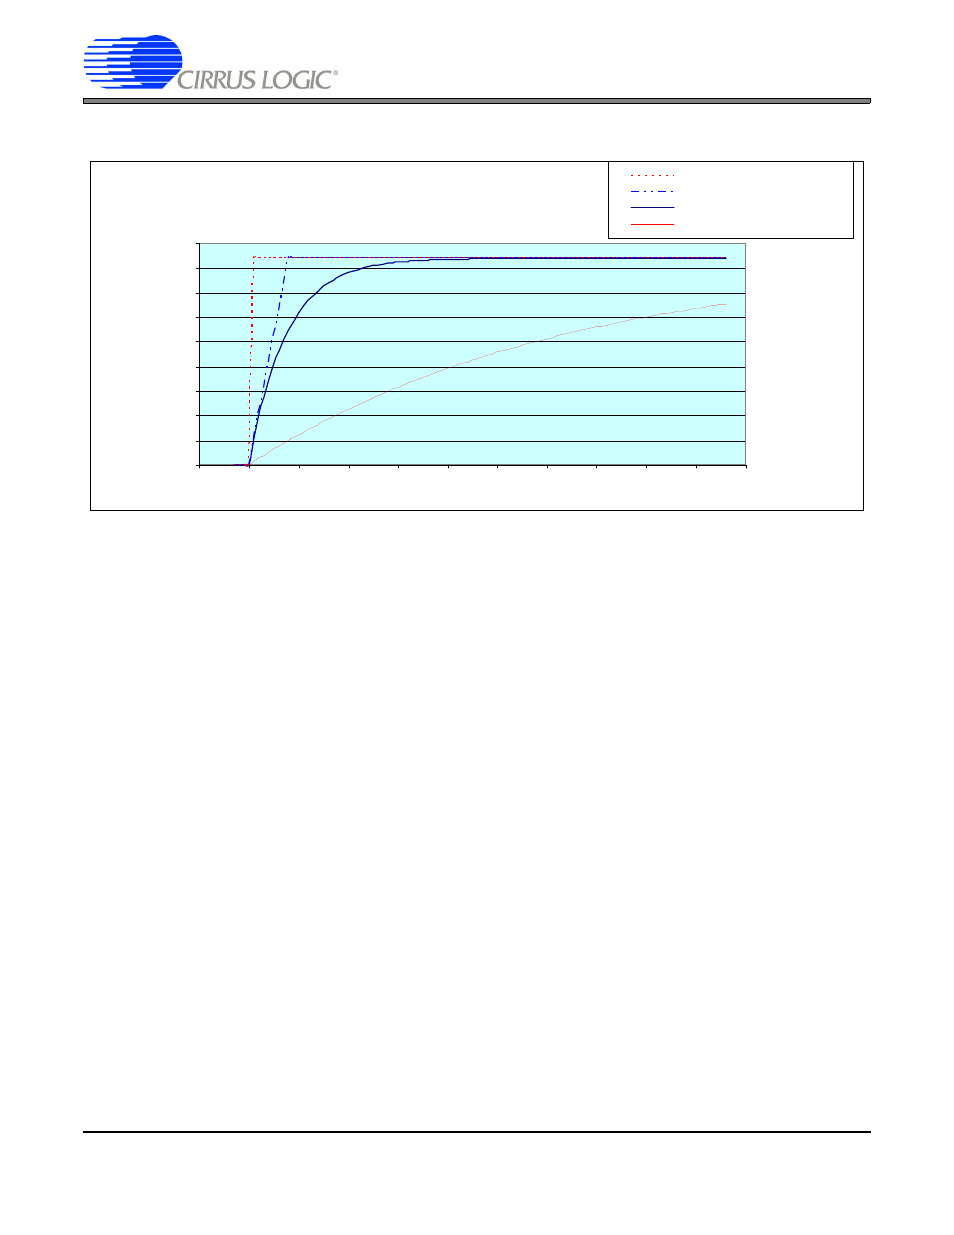
magnitude resulting in higher weights for the new reading. See
to compare the step responses of these
algorithms.
Figure 5. Algorithm Step Response Comparison
Figures 5a, 5b, 5c, and 5d illustrate the typical peak-to-peak noise performance of a CS5532AS with a gain of 64
and word rate of 60 Sps. Figure 5a shows the noise performance without software filtering and the other three plots
illustrate the effects of applying different software filtering algorithms. Without any software filtering, the peak-to-
peak noise is 64 codes or 6 bits, which is consistent with the data sheet’s specification of 18 noise-free bits. With
the simple running average of 8 algorithm, approximately one more bit of noise-free performance can be gained
(peak-to-peak noise of 35 codes), while the simple exponential average of 8 gives slightly better improvement (27
codes peak-to-peak). The simple exponential average of 64 results in approximately 8 codes peak-to-peak or a
noise-free resolution improvement of 3 bits.
Averaging Algorithm Responses
0
2000000
4000000
6000000
8000000
10000000
12000000
14000000
16000000
18000000
-10
0
10
20
30
40
50
60
70
80
90
100
Number of conversions
Ou
tp
u
t C
o
d
e
Exponential Avg. of 8
Running Avg. of 8
Adaptive Avg. of 8
Exp Avg. of 64