10 analyzing data, 11 histogram information, 1 bin – Cirrus Logic CDB5464U User Manual
Page 22: 2 magnitude, Figure 14. his, Cdb5464u
CDB5464U
22
DS847DB1
2.8.10
Analyzing Data
The evaluation software provides three types of analysis tests: Time Domain, Frequency Domain, and
Histogram. The time domain analysis processes acquired conversions to produce a plot of magnitude ver-
sus conversion sample number. The frequency domain analysis processes acquired conversions to pro-
duce a plot of magnitude versus frequency using the Fast-Fourier transform (results up to Fs/2 are
calculated and plotted). Also statistical noise calculations are calculated and displayed. The histogram
analysis processes acquired conversions to produce a histogram plot. Statistical noise calculations are
also calculated and displayed.
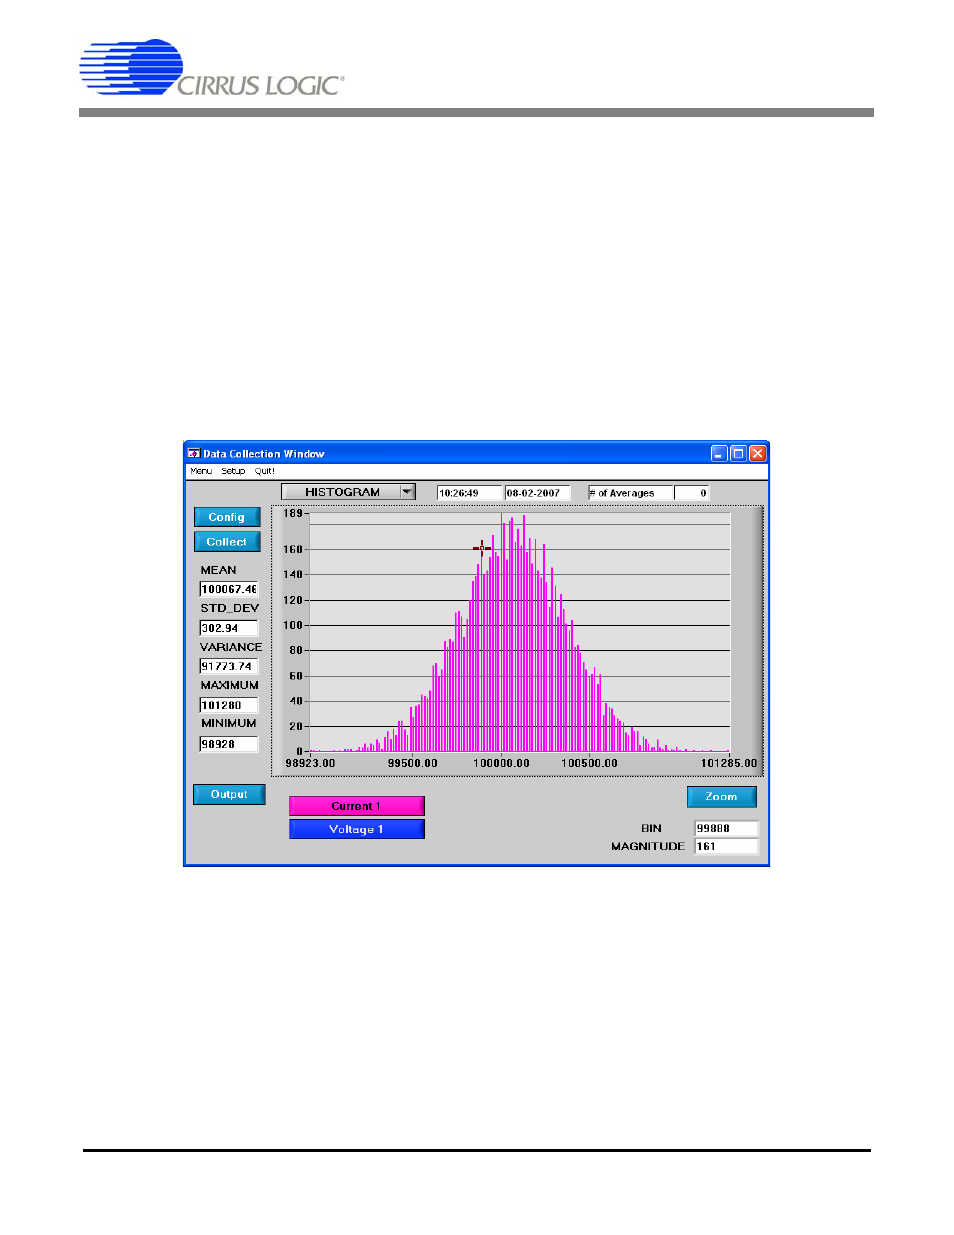
2.8.11
Histogram Information
The following is a description of the indicators associated with histogram analysis. Histograms can be plot-
ted in the Data Collection Window by setting the analysis type pull-down menu to Histogram.
Figure 14. Histogram Analysis
2.8.11.1 BIN
Displays the x-axis value of the cursor on the histogram.
2.8.11.2 MAGNITUDE
Displays the y-axis value of the cursor on the histogram.