2 psr feedback performance versus frequency, An257 – Cirrus Logic AN257 User Manual
Page 5
AN257
AN257REV1
5
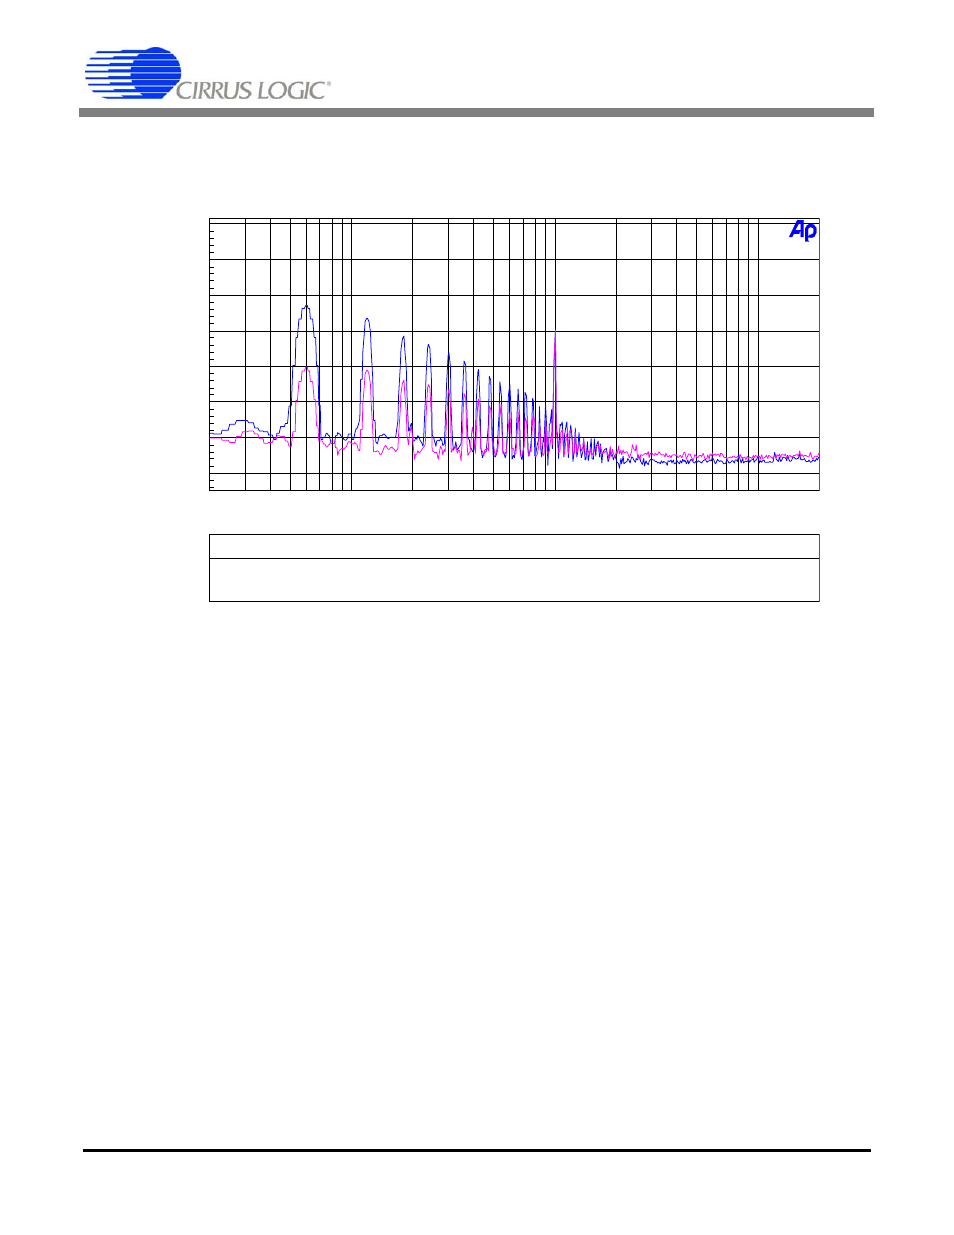
7) To show the effect of this noise modulation on low-level audio signals, set the amplitude of the 1kHz
tone on channel A to
-
60 dBFS. Channel B remains at 60 Hz, 0 dBfs signal. Figure 5 shows the same
tests as above. The blue trace is the FFT of channel A’s output with PSR turned off. The magenta
trace represents channel A’s output with PSR feedback enabled.
2.2
PSR Feedback Performance Versus Frequency
The following graph in Figure 6 shows the amount of rejection that PSR Feedback will provide
versus the frequency of the power supply noise (typically in the low-frequency range). The fre-
quency on channel B, which induces the ripple voltage on the channel under test (channel A), is
varied from 20 Hz to 20 kHz. The plot represents the amplitude of the coupled noise from the
power supply rail onto channel A vs. the frequency of the coupled noise.
Zero data is sent to channel A, which is equivalent to muting the amplifier output (not
MUTE50/50). Channel A’s output is not turned off, but rather switches at a modulated nominal
50% duty cycle at a 384-kHz rate. The red trace in the graph represents the amount of ripple volt-
age which is coupled onto channel A’s output from the 0-dBFS signal being played back on chan-
nel B. Since the output of channel A continues to switch, modulation with another channel will
still occur. The natural decay in the amount of ripple voltage present on channel A’s output at
higher frequencies is due to the frequency-dependant reactance of the large, bulk decoupling
electrolytic capacitor.
Color
Sweep
Trace
Line Style
Thick
Data
Axis
Comment
2
1
Blue
Solid
1
Fft.Ch.1 Ampl
Left
Channel B = 60 Hz, 0 dBFS, PSR feedback disabled
3
1
Magenta
Solid
1
Fft.Ch.1 Ampl
Left
Channel B = 60 Hz, 0 dBFS, PSR feedback enabled
-140
+0
-120
-100
-80
-60
-40
-20
d
B
r
A
20
20k
50
100
200
500
1k
2k
5k
10k
Hz
Figure 5. FFT Amplitude vs. Frequency,
Channel A = 1 kHz,
-
60 dBFS, Channel B = 60 Hz, 0 dBFS, PSR feedback enabled/disabled