Psr feedback measurement procedure, 1 power supply rejection performance test, An257 – Cirrus Logic AN257 User Manual
Page 2
AN257
2
AN257REV1
2. PSR Feedback Measurement Procedure
2.1
Power Supply Rejection Performance Test
The test platform used for the performance measurement plots below consists of the CDB44800
(half-bridge channels), with Vpower = +40 V, and a resistive load of 6
Ω. Channel A of the input
audio stream was set to channel 3 on the development board and channel B was set to channel
8.
1) Use an unregulated power supply if available. The PSR rejection performance can be seen using any
type of power supply, however the actual amount of rejection due to PSR feedback will be more visible
with a lightly regulated power supply than with a highly regulated power supply. PSR calibration
should be done before any of the channels are enabled so an accurate representation of the nominal
voltage rail can be captured. See the CS44800/600 datasheet for the PSR calibration routine.
2) Set up the board under test for 2-channel operation with 6-
Ω
resistive loads and execute the appro-
priate script file such that amplified audio is playing from the board and PSR is calibrated. Verify that
PSR Feedback is disabled (CS44800/44600 bit 5 in register 34h set to 0b). The two channels being
used should be in separate power packages, such as channel 3 and channel 8 on the CDB44800, to
minimize the effects of switching noise.
3) Using a digital audio source (such as an Audio Precision), set channel A to be a
-
1-dBFS, 1-kHz sine
wave and set channel B to be a 0-dB, 60-Hz sine wave. Channel B is being used to emulate the har-
monics generated by an inexpensive, poorly regulated power supply. The 60-Hz switching output of
channel B will generate a corresponding ripple voltage on the rail, which will couple into the channel
under test, in this case
channel A.
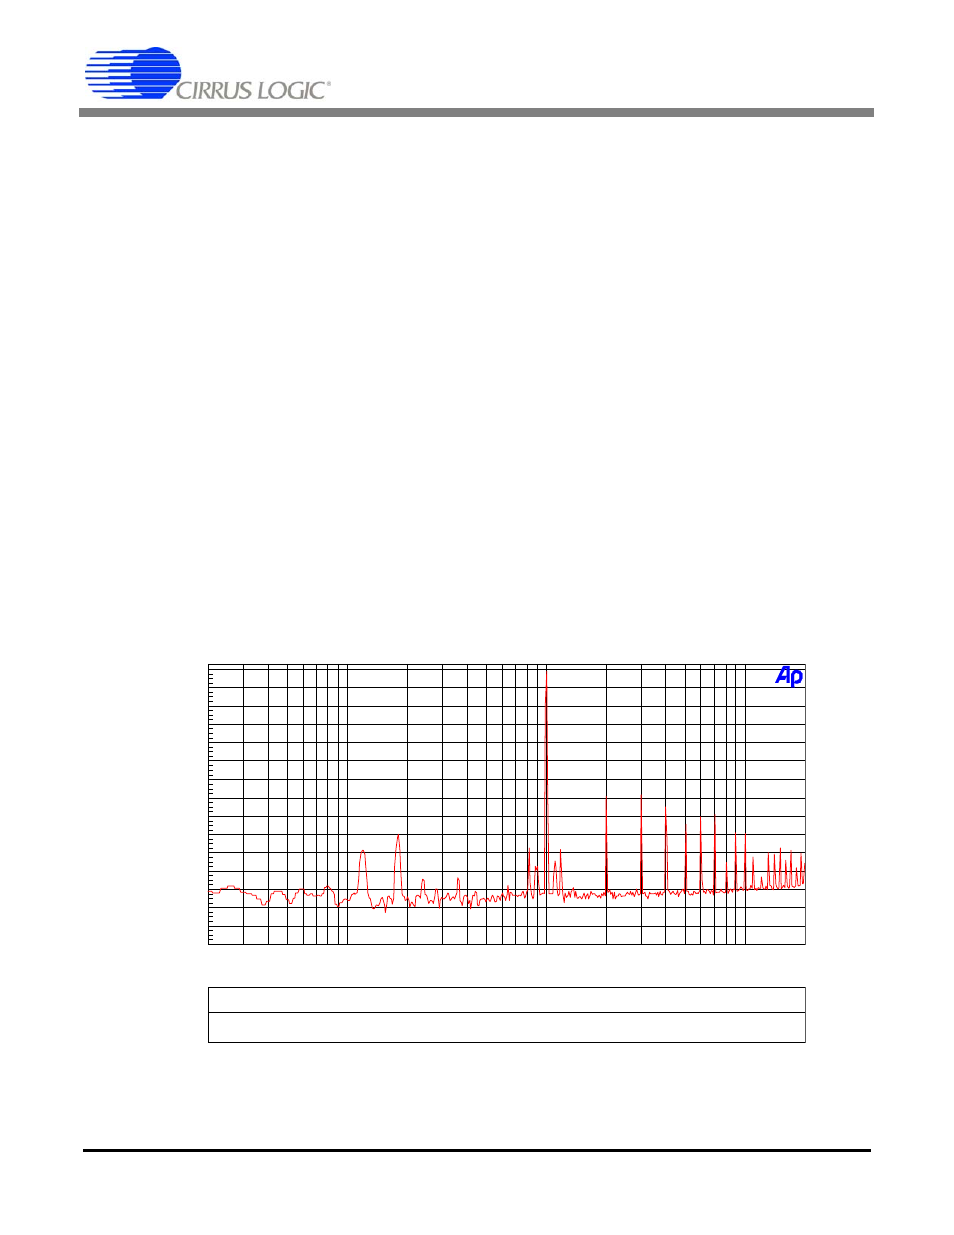
4) With only the channel A PWM output turned on, use an analog analyzer (such as an Audio Precision)
and take an FFT of amplitude versus frequency for channel A. The 1-kHz tone should be present with
an amplitude of
-
1 dBFS. Figure 1 shows the results with only channel A enabled as a baseline.
Color
Sweep
Trace
Line Style
Thick
Data
Axis
Comment
1
1
Red
Solid
1
Fft.Ch.1 Ampl
Left
Channel B = disabled, PSR feedback disabled
-150
+0
-140
-130
-120
-110
-100
-90
-80
-70
-60
-50
-40
-30
-20
-10
d
B
r
A
20
20k
50
100
200
500
1k
2k
5k
10k
Hz
Figure 1. FFT Amplitude vs. Frequency,
Channel A = 1 kHz,
-
1 dBFS, Channel B = disabled, PSR feedback disabled