6 pie chart tab – Allied Telesis AT-VIEW PLUS 2.3 DEVICE MANAGER User Manual
Page 88
Allied Telesyn
AT-VIEW PLUS
DEVICE MANAGER
PN 613-50504-00 Rev C
Page 88 of 121
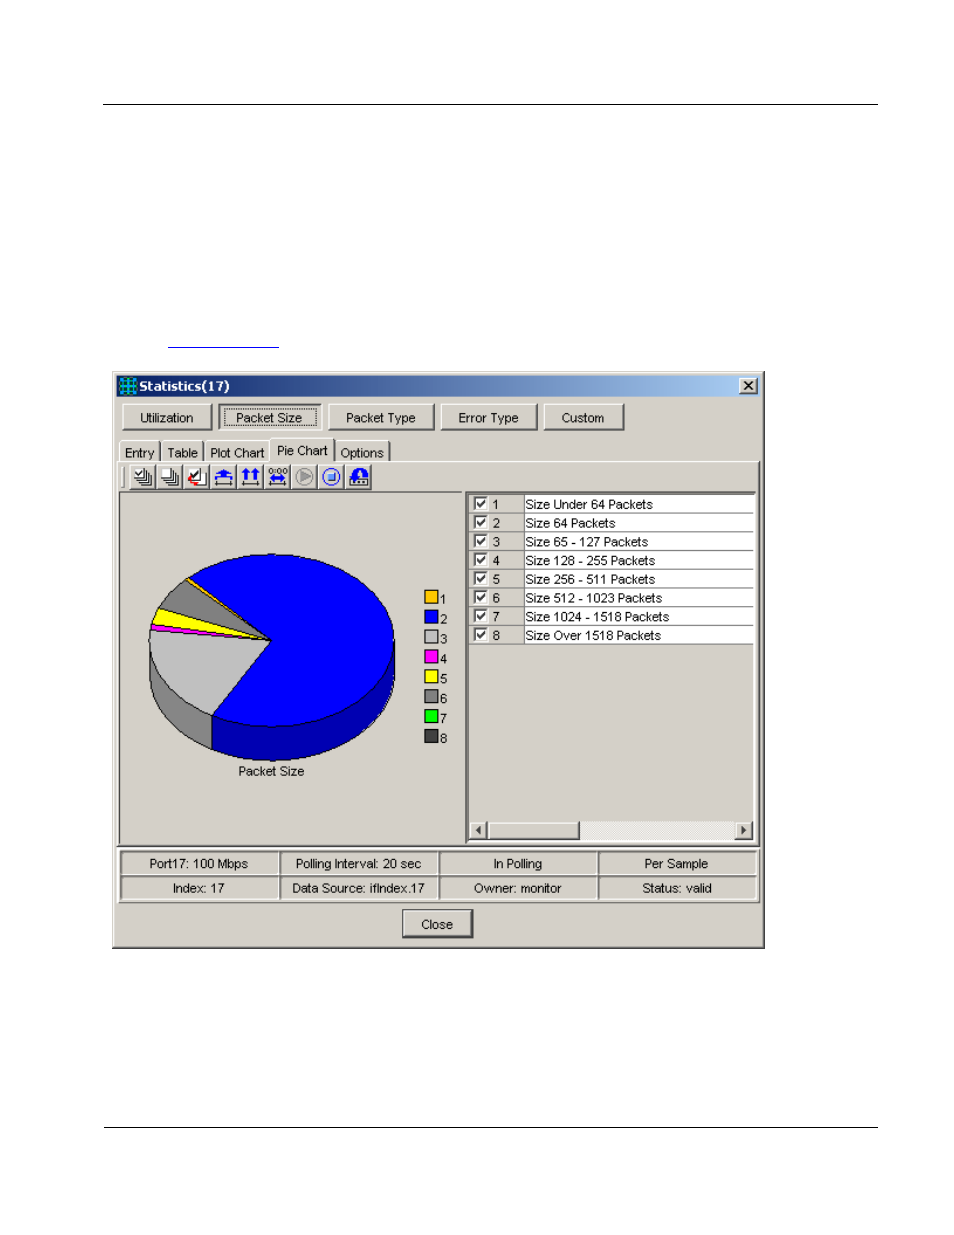
7.2.6 Pie Chart Tab
In the Pie Chart tab, network statistics are shown in a pie chart. This chart is useful for checking the
proportions of the various packet counts. The data is updated at the polling interval.
Note
- The pie chart is not displayed when all data has the value zero.
Topics:
•
Popup Display
RMON Statistics 3-D Pie Chart tab
7.2.6.1 Popup Display
When you move the mouse cursor onto a section of the pie chart, the value of the data for the
selected area is displayed.
See also other documents in the category Allied Telesis Computer hardware:
- AT-GS908M (54 pages)
- AT-x230-10GP (80 pages)
- AT-GS950/48PS (64 pages)
- AT-GS950/10PS (386 pages)
- AT-GS950/16PS (386 pages)
- AT-GS950/48PS (386 pages)
- AT-9000 Series (258 pages)
- AT-9000 Series (1480 pages)
- IE200 Series (70 pages)
- AT-GS950/48 (410 pages)
- AT-GS950/8 (52 pages)
- AT-GS950/48 (378 pages)
- AT-GS950/48 (60 pages)
- SwitchBlade x8106 (322 pages)
- SwitchBlade x8112 (322 pages)
- SwitchBlade x8106 (240 pages)
- SwitchBlade x8112 (240 pages)
- AT-TQ Series (172 pages)
- AlliedWare Plus Operating System Version 5.4.4C (x310-26FT,x310-26FP,x310-50FT,x310-50FP) (2220 pages)
- FS970M Series (106 pages)
- 8100L Series (116 pages)
- 8100S Series (140 pages)
- x310 Series (116 pages)
- x310 Series (120 pages)
- AT-GS950/24 (366 pages)
- AT-GS950/16 (44 pages)
- AT-GS950/24 (404 pages)
- AT-GS950/16 (404 pages)
- AT-GS950/16 (364 pages)
- AT-GS950/8 (404 pages)
- AT-GS950/8 (364 pages)
- AT-GS950/8 (52 pages)
- AT-8100 Series (330 pages)
- AT-8100 Series (1962 pages)
- AT-FS970M Series (330 pages)
- AT-FS970M Series (1938 pages)
- SwitchBlade x3106 (288 pages)
- SwitchBlade x3112 (294 pages)
- SwitchBlade x3106 (260 pages)
- SwitchBlade x3112 (222 pages)
- AT-S95 CLI (AT-8000GS Series) (397 pages)
- AT-S94 CLI (AT-8000S Series) (402 pages)
- AT-IMC1000T/SFP (23 pages)
- AT-IMC1000TP/SFP (24 pages)
- AT-SBx3106WMB (44 pages)