Campbell Scientific PConnect Software for Palm™ OS PDAs User Manual
Page 26
PConnect for the Palm Handheld
When the View Data button is touched, you will see either a list displaying the
data files for that datalogger (PakBus dataloggers), or, the data will be shown
automatically (mixed array dataloggers). For PakBus dataloggers, choose the
table you would like to view. The data will be shown in tabular view.
If the data file you are attempting to view contains more than
32,000 records, you will see the following message:
NOTE
File contains more data records than can be displayed.
Only the last 32,000 records will be viewable from within
PConnect.
The number of records that can be displayed is a limitation of the
Palm OS.
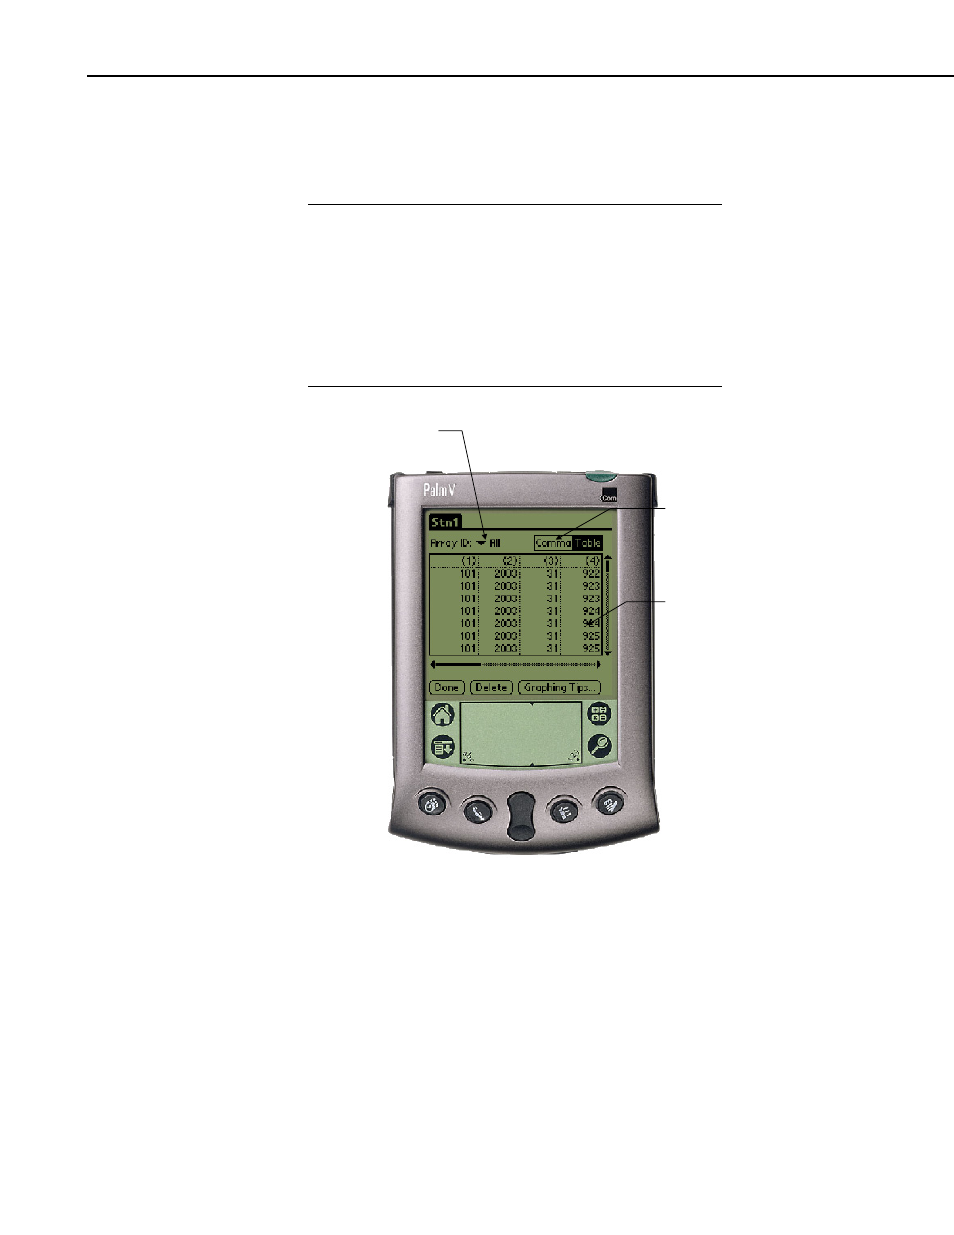
Select an array
to graph
Touch to view as
common separated
Double-click a
column to graph it
To view the data in a comma-separated format, touch the text at the upper right
of the window that reads Comma.
As you scroll through the data for mixed array dataloggers, note that all of the
collected arrays are displayed intermixed as they were retrieved from the
datalogger. To graph a column of data, you must limit the display to only one
array ID. Tap the Array ID drop-down arrow and select the ID of the array
from which you want to graph data. Double tap the column of interest to graph
it. You can scroll back and forth within the data. To see the value and the
time stamp of a particular point, just tap that point.
For mixed array dataloggers if an FSL file with the same name as the DLD file
name exists on the Palm, column labels, graph labels, and time stamps will be
20