Diagram d, Diagram e – Sper Scientific 840052 Data Acquisition Software User Manual
Page 7
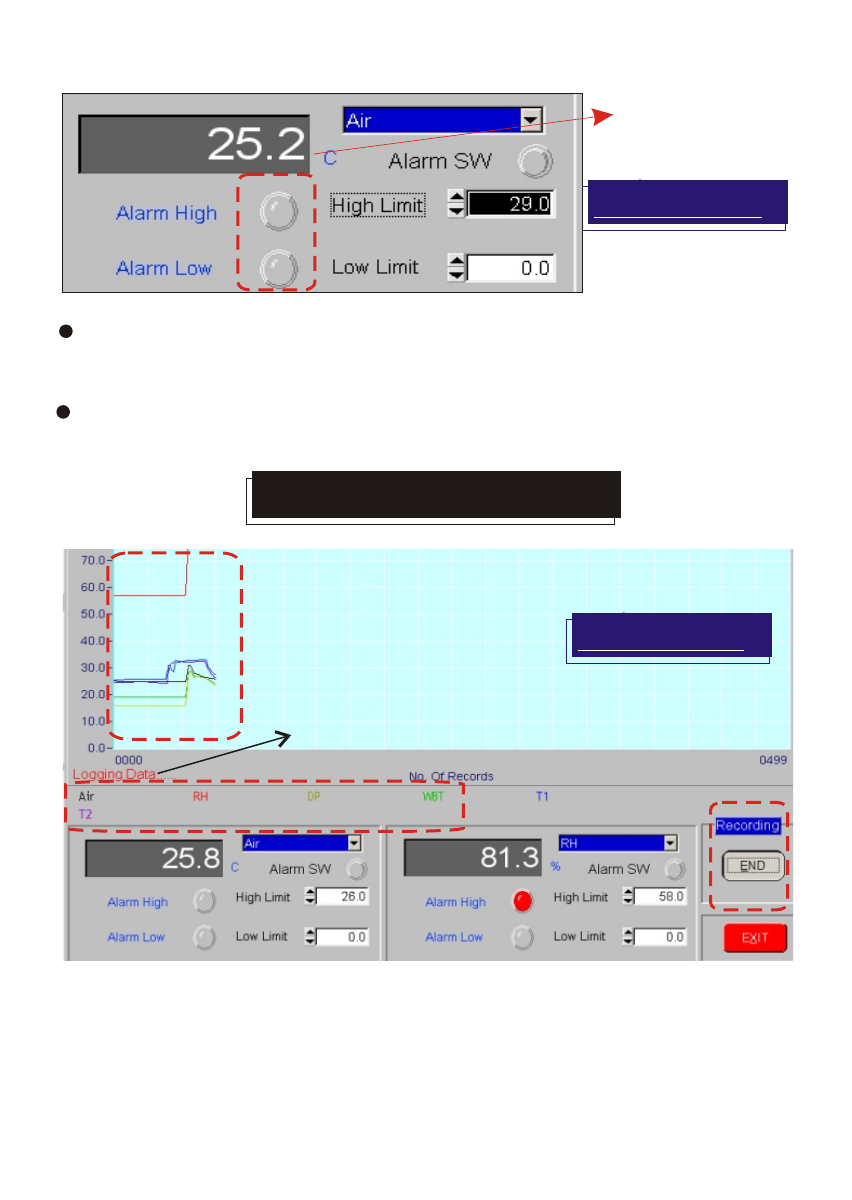
Real time "Air" temperature shows at the left side temperature
block (See Diagram D).
Alarm will be sparkling in red if a measured value exceeds the high
limit or below the low limit.
Diagram D
Real time Value
START RECORDING
Press START button to active the recording. When starting, the text
"Logging Data" will appear on the left corner of the graphic. All
parameters will be shown with different color curves. Different color
texts show below the chart indicate the meaning of each curve. For
example: black curve is Air, red curve is RH......etc.(See Diagram E)
5
Diagram E
On-line logging started
See also other documents in the category Sper Scientific Measuring instruments:
- 840001 Anemometer CFM Datalogger (12 pages)
- 840002 Anemometer Hotwire CFM Datalogger (12 pages)
- 840034 Psychrometer - Anemometer (24 pages)
- 850021 Anemometer RH Pen (8 pages)
- 850022 Anemometer RH Barometer Pen (8 pages)
- 850023 Anemometer SD Card Logger (32 pages)
- 850024 Hot Wire Anemometer SD Card Logger (32 pages)
- 850025 Mini Environmental Quality Meter (16 pages)
- 850026 Mini Environmental Quality Meter (20 pages)
- 850027 Mini Environmental Quality Meter (28 pages)
- 850072 Anemometer Probe (4 pages)
- 850073 Anemometer Probe - Mini Extension (4 pages)
- LUCL-2006 Chlorine Meter (16 pages)
- 850034K AquaShock® Water Purity Kit (24 pages)
- 850036 Large Display Salinity Pen (56 pages)
- 850038 Pure Water Meter (45 pages)
- 850039 Conductivity TDS Meter - Datalogging (12 pages)
- 850081 Water Quality Meter (12 pages)
- 850082 ATC Temperature Probe (4 pages)
- 850083 Conductivity Probe (4 pages)
- 850084 Conductivity TDS Probe (4 pages)
- 860032 Conductivity - TDS - Salinity Bench-Top Meter (72 pages)
- 850045 Dissolved Oxygen - DO Pen (16 pages)
- 850046K AquaShock DO Kit (28 pages)
- 850087 Dissolved Oxygen Probe 4 Meter Cable (4 pages)
- 850068 Hybrid Powered Environmental Meter (28 pages)
- 850069 Environmental Quality Meter w/Sound (32 pages)
- 850070 Environmental Quality Meter - Mini (8 pages)
- 850071 Environmental Quality Meter (36 pages)
- 800036 WBGT Heat Stress Meter (14 pages)
- 800037 WBGT Heat Stress SD Card Logger (36 pages)
- 800046 Indoor Air Quality Meter (20 pages)
- 800047 Oxygen Pen (16 pages)
- 840051 Datalogger (8 pages)
- 850080 Intelligent Software (12 pages)
- 330001 Laser Pointer - Golden (2 pages)
- 100000 Micro Recording Card (2 pages)
- 330004 Microscope Pen (2 pages)
- 840073 Multimeter - Auto-Ranging (32 pages)
- 840079 Multimeter with True RMS (4 pages)
- 330005 Ultra Violet UV Light Pen (2 pages)
- 100005 Ultrasonic Cleaner - Mini (2 pages)
- 330006 UV Light - Laser Pointer - LED Pen (2 pages)
- 840064 Vacuum Meter (8 pages)