Diagram p, Manometer – Sper Scientific 840052 Data Acquisition Software User Manual
Page 14
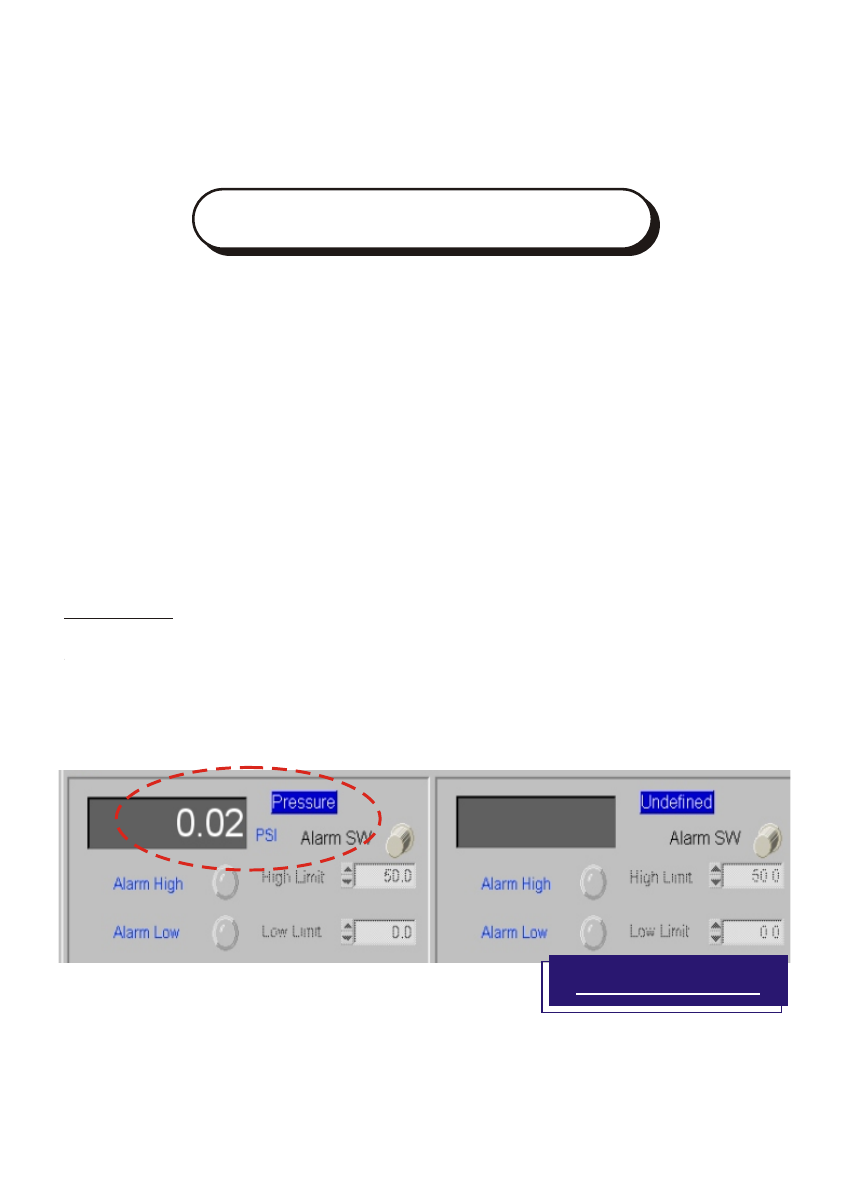
Pressure value is shown in the left block of the screen, the right
block shows Undefined title with no reading. (See Diagram P)
.
12
MANOMETER
There are different screens show on the next few pages for the
examples of different parameters be monitored .
Diagram P
For Differential pressure data logging function, the reading is shown
at the same block in the left.
The meter's unit can be easily changed. There are 11 units for
selection, the unit shows on the software is preselected by the meter.
NOTE: Strongly recommend to reset the display range while
changing the unit.
Baud Rate : 2,400 bit /sec.
Data Bits : 8
Stop Bit : 1
PXXXX(unit)
FORMAT:
See also other documents in the category Sper Scientific Measuring instruments:
- 840001 Anemometer CFM Datalogger (12 pages)
- 840002 Anemometer Hotwire CFM Datalogger (12 pages)
- 840034 Psychrometer - Anemometer (24 pages)
- 850021 Anemometer RH Pen (8 pages)
- 850022 Anemometer RH Barometer Pen (8 pages)
- 850023 Anemometer SD Card Logger (32 pages)
- 850024 Hot Wire Anemometer SD Card Logger (32 pages)
- 850025 Mini Environmental Quality Meter (16 pages)
- 850026 Mini Environmental Quality Meter (20 pages)
- 850027 Mini Environmental Quality Meter (28 pages)
- 850072 Anemometer Probe (4 pages)
- 850073 Anemometer Probe - Mini Extension (4 pages)
- LUCL-2006 Chlorine Meter (16 pages)
- 850034K AquaShock® Water Purity Kit (24 pages)
- 850036 Large Display Salinity Pen (56 pages)
- 850038 Pure Water Meter (45 pages)
- 850039 Conductivity TDS Meter - Datalogging (12 pages)
- 850081 Water Quality Meter (12 pages)
- 850082 ATC Temperature Probe (4 pages)
- 850083 Conductivity Probe (4 pages)
- 850084 Conductivity TDS Probe (4 pages)
- 860032 Conductivity - TDS - Salinity Bench-Top Meter (72 pages)
- 850045 Dissolved Oxygen - DO Pen (16 pages)
- 850046K AquaShock DO Kit (28 pages)
- 850087 Dissolved Oxygen Probe 4 Meter Cable (4 pages)
- 850068 Hybrid Powered Environmental Meter (28 pages)
- 850069 Environmental Quality Meter w/Sound (32 pages)
- 850070 Environmental Quality Meter - Mini (8 pages)
- 850071 Environmental Quality Meter (36 pages)
- 800036 WBGT Heat Stress Meter (14 pages)
- 800037 WBGT Heat Stress SD Card Logger (36 pages)
- 800046 Indoor Air Quality Meter (20 pages)
- 800047 Oxygen Pen (16 pages)
- 840051 Datalogger (8 pages)
- 850080 Intelligent Software (12 pages)
- 330001 Laser Pointer - Golden (2 pages)
- 100000 Micro Recording Card (2 pages)
- 330004 Microscope Pen (2 pages)
- 840073 Multimeter - Auto-Ranging (32 pages)
- 840079 Multimeter with True RMS (4 pages)
- 330005 Ultra Violet UV Light Pen (2 pages)
- 100005 Ultrasonic Cleaner - Mini (2 pages)
- 330006 UV Light - Laser Pointer - LED Pen (2 pages)
- 840064 Vacuum Meter (8 pages)