Diagram g-1 – Sper Scientific 840052 Data Acquisition Software User Manual
Page 10
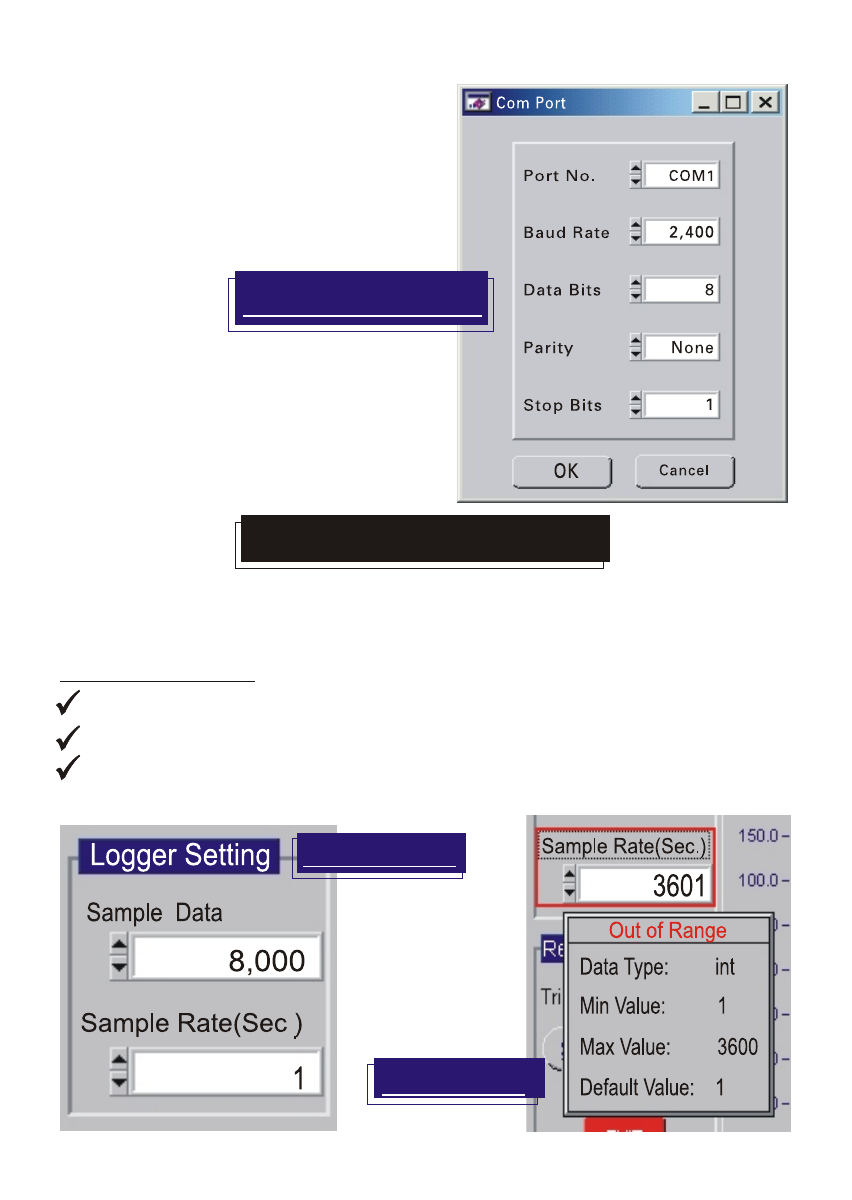
Diagram G-1
LOGGER SETTING
8
There are 3 settings at the left side of the screen:
(1)Logger Setting, (2)Dispaly Range and (3)Display Control.
Sample data: 2000, 4000, 6000, 8000, 10000 records.
Sample rate (Second): 1~3600.
If the rate entered is out of the range, an "out of range" chart will
appear as Diagram I and show the valid min. & max. values.
(1)Logger Setting (See Diagram H)
Diagram H
Diagram I
See also other documents in the category Sper Scientific Measuring instruments:
- 840001 Anemometer CFM Datalogger (12 pages)
- 840002 Anemometer Hotwire CFM Datalogger (12 pages)
- 840034 Psychrometer - Anemometer (24 pages)
- 850021 Anemometer RH Pen (8 pages)
- 850022 Anemometer RH Barometer Pen (8 pages)
- 850023 Anemometer SD Card Logger (32 pages)
- 850024 Hot Wire Anemometer SD Card Logger (32 pages)
- 850025 Mini Environmental Quality Meter (16 pages)
- 850026 Mini Environmental Quality Meter (20 pages)
- 850027 Mini Environmental Quality Meter (28 pages)
- 850072 Anemometer Probe (4 pages)
- 850073 Anemometer Probe - Mini Extension (4 pages)
- LUCL-2006 Chlorine Meter (16 pages)
- 850034K AquaShock® Water Purity Kit (24 pages)
- 850036 Large Display Salinity Pen (56 pages)
- 850038 Pure Water Meter (45 pages)
- 850039 Conductivity TDS Meter - Datalogging (12 pages)
- 850081 Water Quality Meter (12 pages)
- 850082 ATC Temperature Probe (4 pages)
- 850083 Conductivity Probe (4 pages)
- 850084 Conductivity TDS Probe (4 pages)
- 860032 Conductivity - TDS - Salinity Bench-Top Meter (72 pages)
- 850045 Dissolved Oxygen - DO Pen (16 pages)
- 850046K AquaShock DO Kit (28 pages)
- 850087 Dissolved Oxygen Probe 4 Meter Cable (4 pages)
- 850068 Hybrid Powered Environmental Meter (28 pages)
- 850069 Environmental Quality Meter w/Sound (32 pages)
- 850070 Environmental Quality Meter - Mini (8 pages)
- 850071 Environmental Quality Meter (36 pages)
- 800036 WBGT Heat Stress Meter (14 pages)
- 800037 WBGT Heat Stress SD Card Logger (36 pages)
- 800046 Indoor Air Quality Meter (20 pages)
- 800047 Oxygen Pen (16 pages)
- 840051 Datalogger (8 pages)
- 850080 Intelligent Software (12 pages)
- 330001 Laser Pointer - Golden (2 pages)
- 100000 Micro Recording Card (2 pages)
- 330004 Microscope Pen (2 pages)
- 840073 Multimeter - Auto-Ranging (32 pages)
- 840079 Multimeter with True RMS (4 pages)
- 330005 Ultra Violet UV Light Pen (2 pages)
- 100005 Ultrasonic Cleaner - Mini (2 pages)
- 330006 UV Light - Laser Pointer - LED Pen (2 pages)
- 840064 Vacuum Meter (8 pages)