3 graph report, 4 pie chart report – Thermo Fisher Scientific Alpha Link 600 Communications Software User Manual
Page 20
14
3.2.3
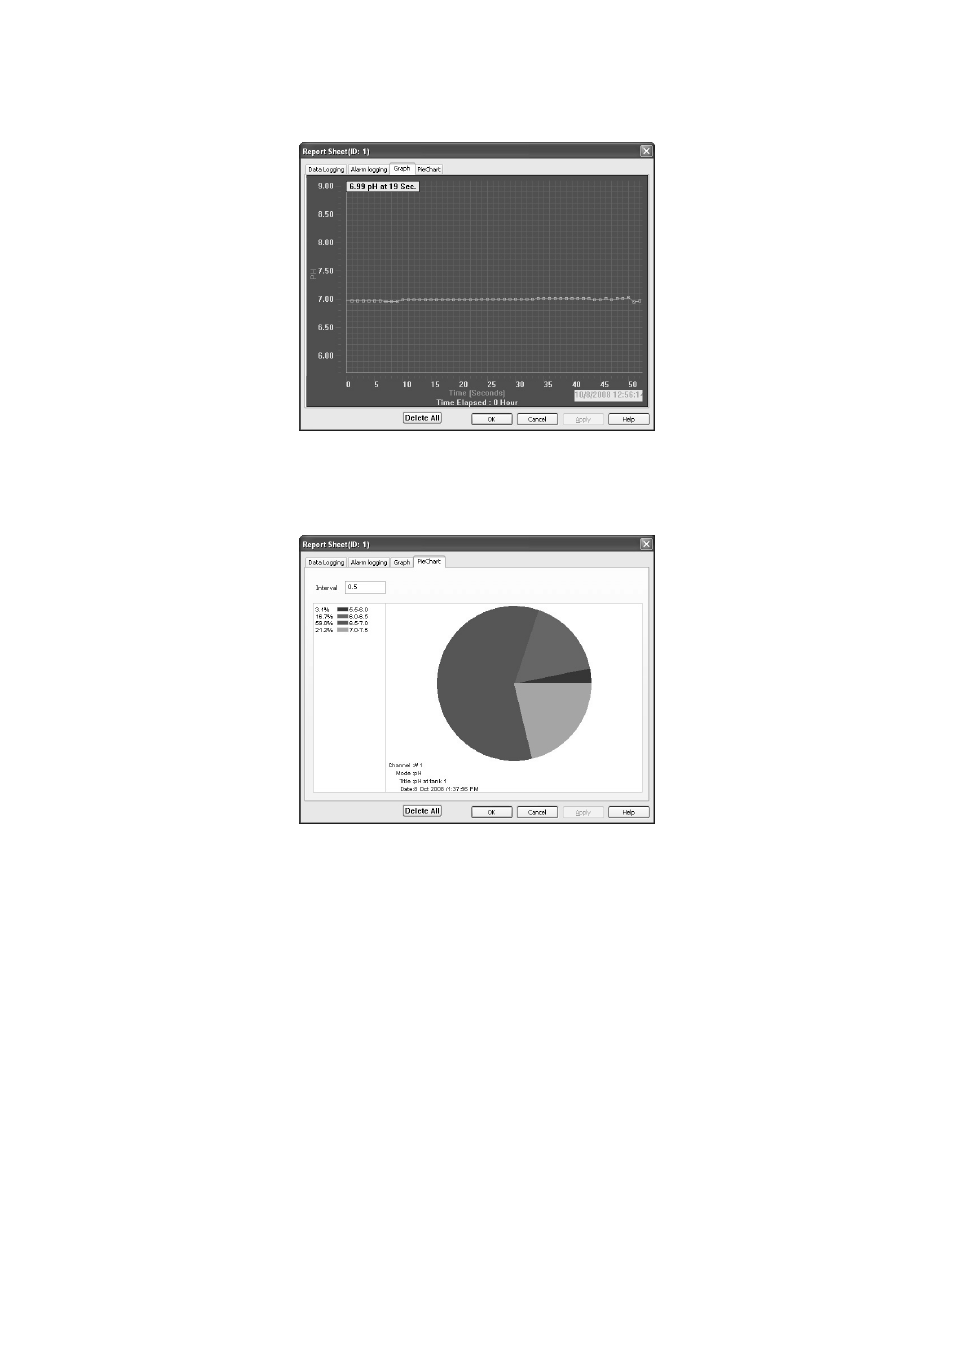
Graph Report
Data displayed in line graph format to show fluctuation patterns. Hover mouse over a
node to see the measurement value, time and date of the data.
Figure 19 : Graph Report
3.2.4
Pie Chart Report
Data displayed in pie-chart format to show percentage of readings in each range, up to
0.1 intervals.
Figure 20 : Pie Chart Report
See also other documents in the category Thermo Fisher Scientific Tools:
- PCTestr 35 (2 pages)
- pHScan BNC (3 pages)
- pHScan 3/3+ (5 pages)
- pHTestr 1 (3 pages)
- pHTestr 10/20/30/10 BNC/Spear (2 pages)
- ORPTestr 10/10 BNC (2 pages)
- EC/TDS/SaltTestr 11 (4 pages)
- EC/TDS/SaltTestr (2 pages)
- ECScan High/Low & TDScan High/Low (9 pages)
- SaltTestr (2 pages)
- EcoTestr pH 2 (2 pages)
- EcoTestr pH 1 (2 pages)
- EcoTestr EC High (2 pages)
- EcoTestr EC Low (2 pages)
- EcoTestr TDS High (2 pages)
- EcoTestr TDS Low (2 pages)
- EcoTestr Salt (2 pages)
- Eutech pH 5/6 Plus & Ion 6 Plus (New version R1.1, SN >797406) (23 pages)
- Eutech pH 5/6 Plus & Ion 6 Plus (Old version EP6, SN <797406, discontinued) (23 pages)
- Eutech COND/TDS/Salt 6 Plus (40 pages)
- Eutech DO 6 Plus (48 pages)
- EcoScan pH/Ion 5 & 6 (27 pages)
- EcoScan CON 6 & TDS 6 (56 pages)
- EcoScan CON 5 & TDS 5 (18 pages)
- EcoScan Salt 6 (40 pages)
- EcoScan DO 6 (80 pages)
- CyberScan pH 10/pH 100 (67 pages)
- CyberScan pH 11/pH 110 (76 pages)
- CyberScan CON 10/CON 100/CON 200 (62 pages)
- CyberScan CON 11/CON 110 (80 pages)
- CyberScan DO 110 (60 pages)
- CyberScan PCD 650 (127 pages)
- CyberScan CON 400/410 (For units manufactured before March 2010, discontinued) (60 pages)
- CyberScan CON 400 (For units manufactured from March 2010 onwards) (60 pages)
- CyberScan pH 300/310 (52 pages)
- CyberScan DO 300 (60 pages)
- CyberScan PC 300 (72 pages)
- CyberScan PD 300 (76 pages)
- CyberScan PC 10 (31 pages)
- C401 Colorimeter (64 pages)
- TN100 Turbidimeter (31 pages)
- RS232C Interface Adapter (9 pages)
- Thermo Scientific Temp 360 (44 pages)
- Thermo Scientific Temp 340 (40 pages)
- Thermo Scientific Temp 300 (32 pages)