Thermo Fisher Scientific Alpha Link 600 Communications Software User Manual
Page 16
10
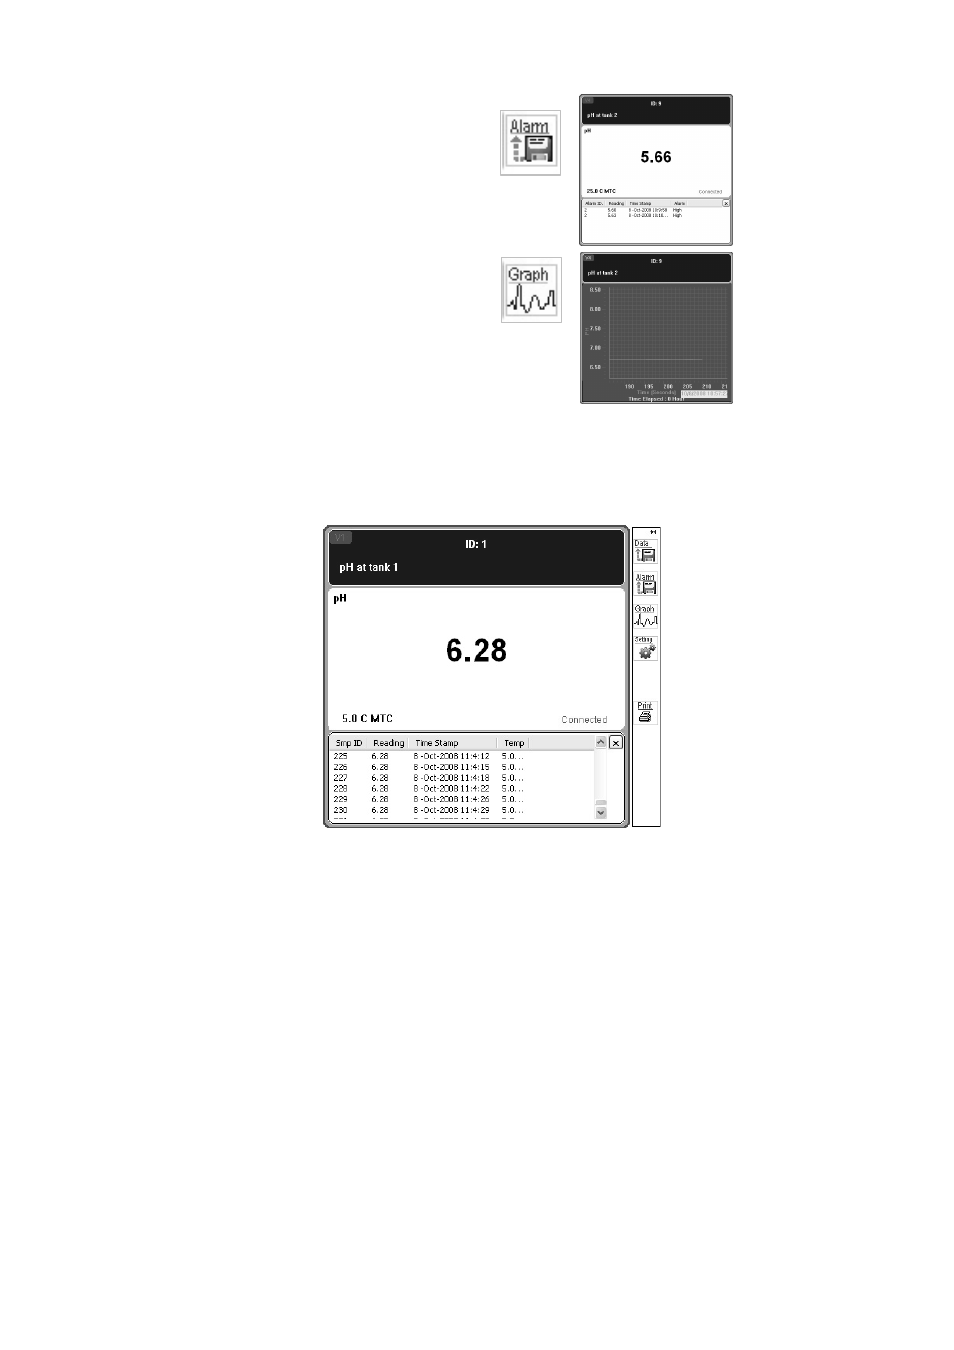
2. Alarm Logging View
Log of alarms when measurements fall
below or exceed set limits.
3. Graph
View
Line graph to exhibit measurement
trend over time.
To select the view you want:
1. Click on a view window. A pop-up menu will appear (Figure 13).
2. Select “Data”, “Alarm” or “Graph” according to the view you want.
Figure 13 : View Window Pop-Up Menu
See also other documents in the category Thermo Fisher Scientific Tools:
- PCTestr 35 (2 pages)
- pHScan BNC (3 pages)
- pHScan 3/3+ (5 pages)
- pHTestr 1 (3 pages)
- pHTestr 10/20/30/10 BNC/Spear (2 pages)
- ORPTestr 10/10 BNC (2 pages)
- EC/TDS/SaltTestr 11 (4 pages)
- EC/TDS/SaltTestr (2 pages)
- ECScan High/Low & TDScan High/Low (9 pages)
- SaltTestr (2 pages)
- EcoTestr pH 2 (2 pages)
- EcoTestr pH 1 (2 pages)
- EcoTestr EC High (2 pages)
- EcoTestr EC Low (2 pages)
- EcoTestr TDS High (2 pages)
- EcoTestr TDS Low (2 pages)
- EcoTestr Salt (2 pages)
- Eutech pH 5/6 Plus & Ion 6 Plus (New version R1.1, SN >797406) (23 pages)
- Eutech pH 5/6 Plus & Ion 6 Plus (Old version EP6, SN <797406, discontinued) (23 pages)
- Eutech COND/TDS/Salt 6 Plus (40 pages)
- Eutech DO 6 Plus (48 pages)
- EcoScan pH/Ion 5 & 6 (27 pages)
- EcoScan CON 6 & TDS 6 (56 pages)
- EcoScan CON 5 & TDS 5 (18 pages)
- EcoScan Salt 6 (40 pages)
- EcoScan DO 6 (80 pages)
- CyberScan pH 10/pH 100 (67 pages)
- CyberScan pH 11/pH 110 (76 pages)
- CyberScan CON 10/CON 100/CON 200 (62 pages)
- CyberScan CON 11/CON 110 (80 pages)
- CyberScan DO 110 (60 pages)
- CyberScan PCD 650 (127 pages)
- CyberScan CON 400/410 (For units manufactured before March 2010, discontinued) (60 pages)
- CyberScan CON 400 (For units manufactured from March 2010 onwards) (60 pages)
- CyberScan pH 300/310 (52 pages)
- CyberScan DO 300 (60 pages)
- CyberScan PC 300 (72 pages)
- CyberScan PD 300 (76 pages)
- CyberScan PC 10 (31 pages)
- C401 Colorimeter (64 pages)
- TN100 Turbidimeter (31 pages)
- RS232C Interface Adapter (9 pages)
- Thermo Scientific Temp 360 (44 pages)
- Thermo Scientific Temp 340 (40 pages)
- Thermo Scientific Temp 300 (32 pages)