Thermo Fisher Scientific Ion Selective Electrodes Copper User Manual
Page 9
Instruction Manual
Copper Electrode
9
6. Place 100 ml of the 10
-2
M or 1000 ppm standard in a 150
ml beaker, place the beaker on the magnetic stirrer and
begin stirring at a constant rate.
7. After rinsing the electrode(s) with distilled water and
blotting dry, immerse the electrode tip(s) in the
solution. When the reading has stabilized, record the
mV reading.
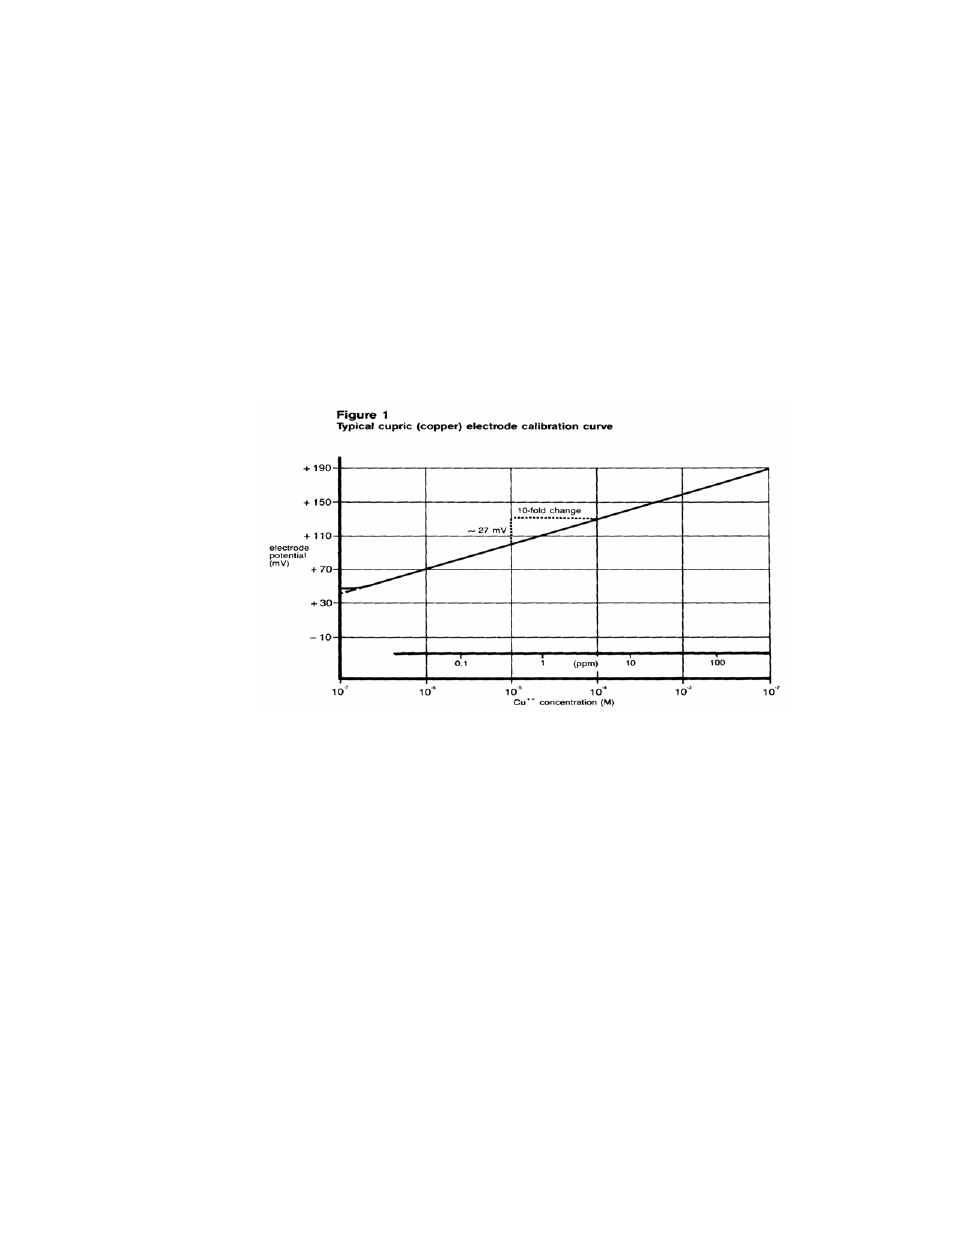
8. Using the semi-logarithmic graph paper, plot the mV
reading (linear axis) against concentration (log axis).
A typical calibration curve can be found in Figure 1.
A calibration curve is constructed on semi-
logarithmic paper when using a pH/mV meter
in the millivolt mode. The measured
electrode potential in mV (linear axis) is
plotted against the standard concentration
(log axis). In the linear region of the
curve, only three standards are necessary
to determine a calibration curve. In the
non-linear region, additional points must
be measured. The direct measurement
procedures given are for the linear portion
of the curve. The non-linear portion of
the curve requires the use of low level
procedures.
9.
To a clean, dry 150 ml beaker, add 100 ml of the sample
and 2 ml of ISA. Place the beaker on the magnetic
stirrer and begin stirring at a constant rate.
10. After rinsing the electrode tip(s) in distilled water