Figure 20 - ssc test results, Qphy-sas2 software option – Teledyne LeCroy QPHY-SAS2 User Manual
Page 29
QPHY-SAS2 Software Option
917718 Rev
A
29
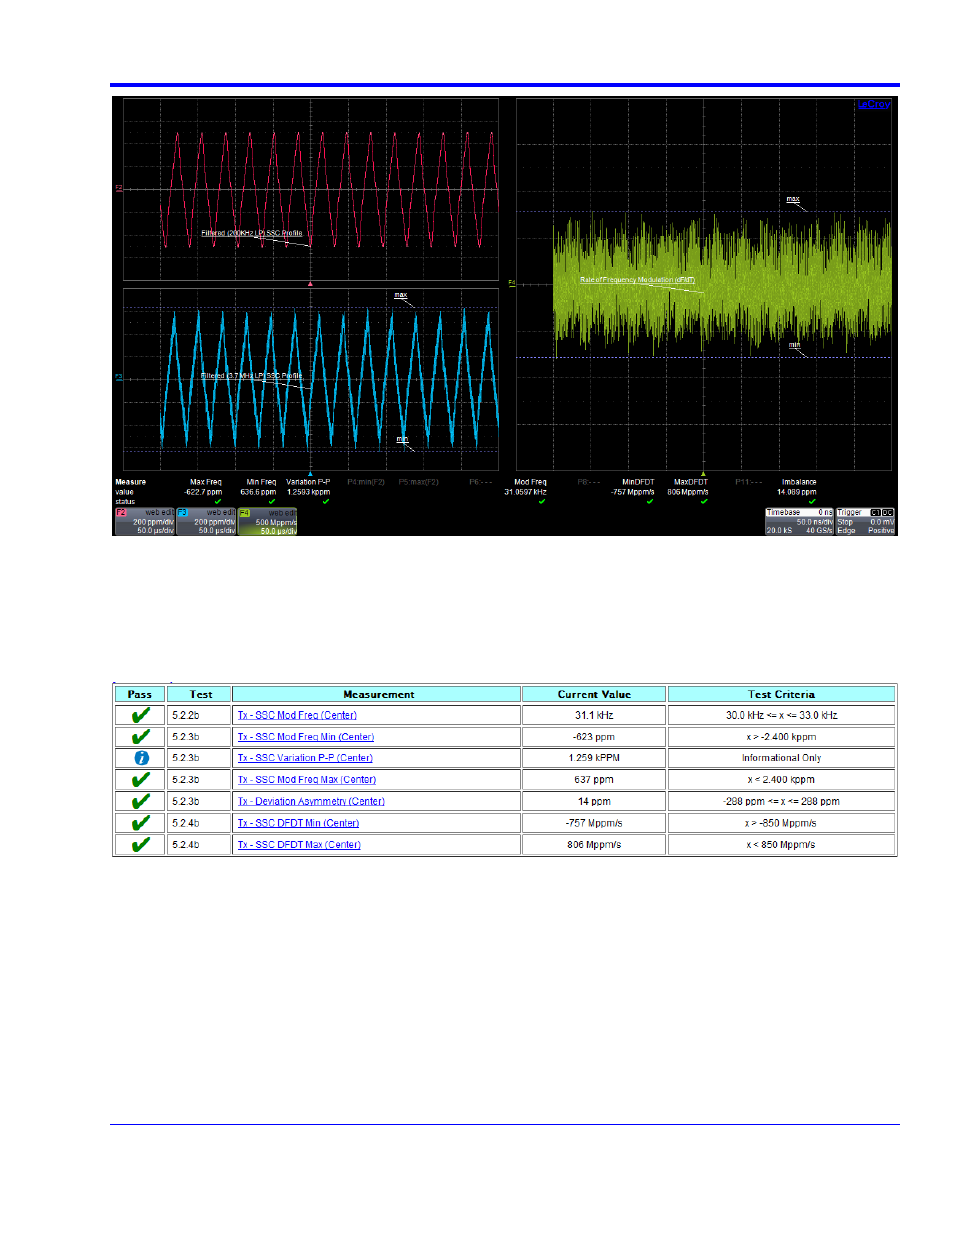
Figure 19 - Oscilloscope Configuration after SSC Tests
Shown on this screen:
F2 is the SSCTrack of the input. This signal is filtered by a 4
th
order Butterworth filter with a 200kHz cutoff
as described by the specification.
F3 is the SSCTrack of the input without the effects of the 4
th
order Butterworth filter used by F2.
F4 is the Rate of Frequency Modulation (dF/dT). This is calculated by: slope = (f(t)
–f(t–0.27us))/0.27 us).
Figure 20 - SSC Test Results
In the Measure section:
Max Freq and Min Freq (P1 and P2) are calculated by measuring the minimum and maximum of the
Unfiltered SSCTrack (F3). These are the measured values for Tx - SSC Mod Freq Min and Tx - SSC
Mod Freq Max (5.2.3). These values must be in between +/- 2400 kppm in order to pass this test for
center spreading, between -100 ppm and 2400 ppm for up spreading, and -2400 ppm and 100 ppm for
down spreading.
Variation P-P (P3) is the difference between the Max Freq and Min Freq of the Unfiltered SSCTrack.
This is the measured value for Tx - Variation P-P (5.2.3). This is shown for information only.
Mod Freq (P7) is calculated by measuring the frequency @ level of the Filtered SSCTrack (F2). This is
the measured value for Tx - SSC Mod Freq (5.2.2). This value must be between 30kHz and 33kHz
(inclusive) in order to pass this test.