Figure 60 – tdss/tdsh results, Tdqs/tdqh, dq to dqs setup/hold time – Teledyne LeCroy QPHY-DDR4 User Manual
Page 67
QPHY-DDR4 Software Option
Shown on this screen:
• Z1 is a zoom of F1, the acquired CK signal after any probe deskew has been applied. The zoom is
position at the location of the “worst case” tDSS measurement indicated by t@tDSSmax. A trace
label is applied on this trace at Vref.
• Z2 is a zoom of F2, the acquired DQS signal after any probe deskew has been applied. The zoom is
positioned at the location of the “worst case” tDSS measurement indicated by t@tDSSmax. A
trace label is applied at Vref on this trace according to the signal name assigned to DQS.
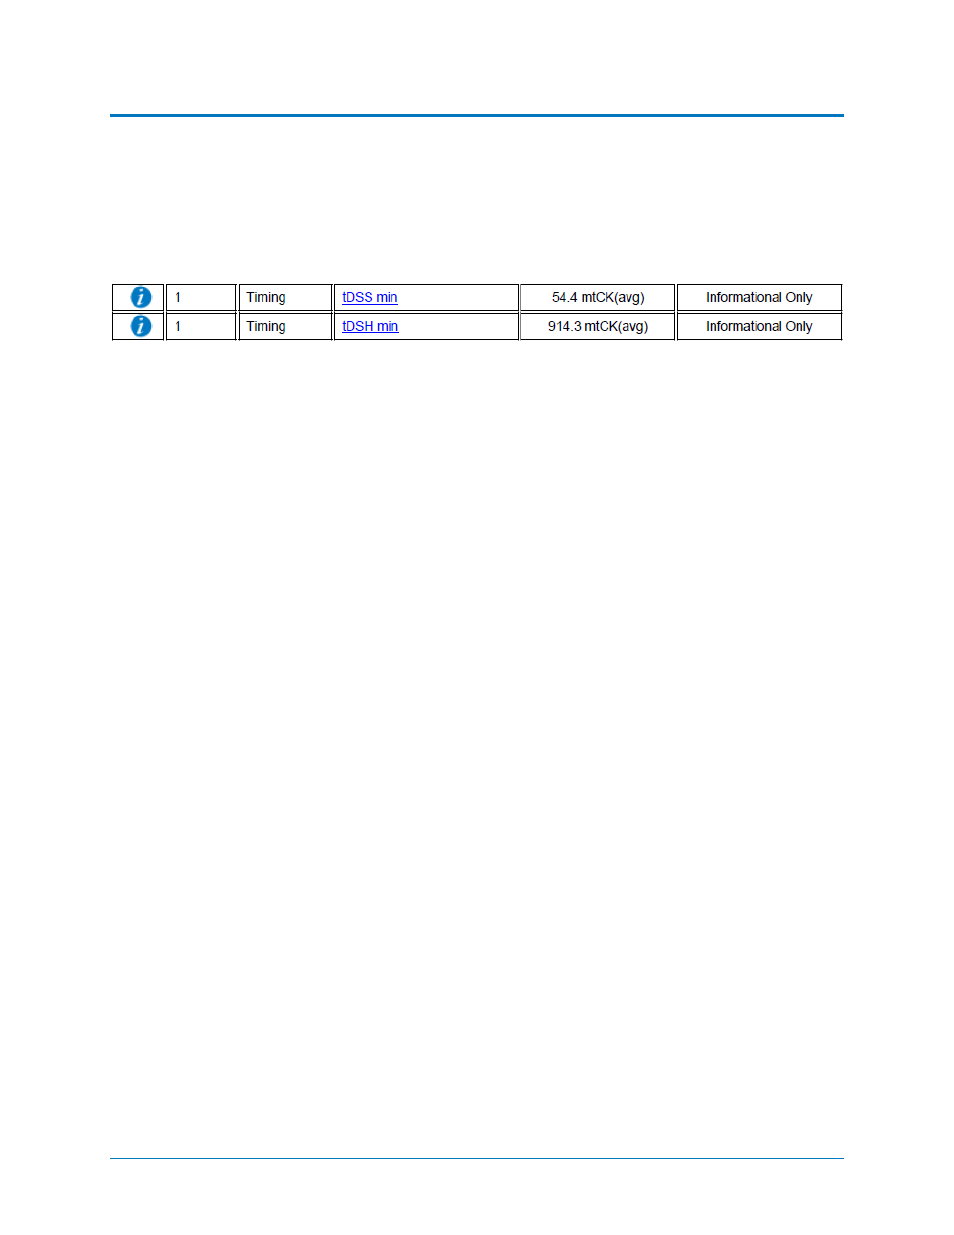
Figure 60 – tDSS/tDSH Results
In the Measure section:
• tDSS (P1) is measuring the setup time from when DQS crossed Vref to when Ck crosses Vref.
Essentially the time between the two trace labels is measured. The minimum value is the
measured value for tDSS min and is reported in mtCK(avg). This test is considered informational
only since the limit is undefined.
• tDQDQS (P2) is measuring the skew between DQ and DQS. Since this measurement is performed
once per burst, this shows how many W bursts were in the acquired waveform.
• t@tDSSmin (P4) displays the location of where the minimum value of tDSS occurred. This is used
to position the zoom traces at the location of the “worst case results”.
924291 Rev A
67